Regulatory hurdles, economics cloud prospects for US LNG exports

James T. Jensen
Jensen Associates
Weston, Mass.
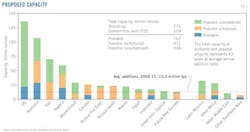
As with most LNG news from North America, excess is common (Fig. 1). In fact, most proposed and planned LNG export projects will never see the light of day.
Selecting which will be successful, however, has been likened to "handicapping a horse race." Such handicapping against the competition requires an understanding of regulatory hurdles and competitive economics.
Turnaround
Of the 71 million tonnes of global LNG liquefaction capacity that came on line between 2009 and 2011, 26% was originally destined for North American markets. As of July 1, 2012, however, there are 12 LNG export projects proposed for the US and 3 for Canada.
Their combined capacities—186 million tonnes—are equivalent to 68% of the entire world's installed capacity at Jan. 1 of this year. In addition, consideration of Alaskan LNG exports is now back on the table, potentially representing as much as another 23 million tonnes.
Among the large number of proposed LNG export projects, complex US regulatory requirements will severely limit how many are finally approved.
On the economic side, the price disequilibrium between low-cost commodity gas in North America and oil-linked contract supply in Europe and Asia has created numerous North American LNG export opportunities. If we assume price projections from the International Energy Agency, export of US LNG to Asia appears to make economic sense. Asian margins are partly protected by the high cost of alternative supply.
Export of US LNG to Europe is more speculative. It is sensitive not only to US wellhead prices but also, for Northwest Europe, to Atlantic Basin arbitrage through the UK and the Low Countries.
Regulatory paths
Regulatory hurdles exist at both federal and state levels.
At the federal level, two major approvals are required:
1. Export authorization from the Department of Energy's Office of Fossil Energy.
2. The Federal Energy Regulatory Commission's "Certificate of Public Convenience and Necessity"—the required authorization for facility construction.
Other federal agencies that may also be involved are the US Coast Guard, the Environmental Protection Agency, and the Office of Pipeline Safety.
DOE approval is automatic for Free Trade Agreement countries: okay for Korea but not for China, Japan, or EU countries. Cheniere Energy's project in Cameron Parish, La., on Sabine Pass now has all the necessary DOE approvals (OGJ Online, Mar. 5, 2012).
FERC certificates, on the other hand, require lengthy judicial hearings and bring out intervention from environmentalists and those concerned about upward pressures on wellhead natural gas prices. The price-sensitive group includes such industries as petrochemicals and electric and gas utilities.
The principal target of environmentalists has been hydraulic fracturing. The groups have been successful at the state level (New York) and will be active in any FERC proceedings.
But there is also a group whose goal is to reduce carbon emissions. They see cheap gas frustrating the transition to renewables. This group was largely responsible for the delay in the Keystone XL Pipeline for oil sands supply (OGJ Online, Jan. 21, 2012). It may be easier to overcome the environmental objections if the supply enhances domestic energy security, but more difficult if it is for export (the specter of "oil industry profits over public interest").
It is possible that no exports will be permitted: US Rep. Edward J. Markey (D-Mass.) has sponsored legislation to prevent it. But it is more likely that exports will be allowed and that FERC will determine how fast and how far export approvals proceed.
Since approvals are on a case-by-case basis, strong opposition has a chance to develop against later projects, particularly if evidence of adverse economic or environmental effects begins to appear.
Prices, financing
Economic feasibility depends on buyer contractual commitments and on financing. Bankers' willingness to lend to these atypical projects will exert a strong influence on how many ultimately get built. Total estimated capital expenditures for all of them will be very large, nearly $100 billion for the US plants alone. But they will require contracts from willing buyers who will undertake the debt service obligation.
Most North American LNG export contracts differ from traditional contracts. LNG projects have traditionally been driven by producers who wanted to monetize stranded gas discoveries. Thus the contracts usually dedicate specific reserves to the trade. While that may remain true in British Columbia and in Alaska, the Gulf Coast projects will rely on freely traded commodity supply where monetization is not an issue. And the East and West Coast US projects will tap commodity supply from the pipeline system.
These projects are driven largely by the arbitrage potential created by the disequilibrium between different pricing structures: oil-linked contract prices and US commodity prices on the one hand and the different way Europe and Asia figure oil linkage on the other—disequilibria that the 2009-10 LNG surplus failed to eliminate.
Price spreads in the major markets earlier this year—Henry Hub $2.20, National Balancing Point (NBP) $9.63, and Japanese LNG $16.34 in March—are unrealistically wide and give a distorted view of the economics of LNG export. The price projections of the international forecasting agencies, the US Energy Information Administration and the International Energy Agency, provide a better measure of the possible economic incentives for exports.
IEA's projections in its World Energy Outlook 2011 for 2020 are US $6.70, Europe $10.40, and Japan $12.90.1
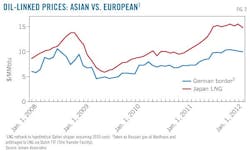
EIA does not publish its international prices, but its Henry Hub projection for 2020 in its Annual Energy Outlook 2011 is lower, at $5.18.2 Fig. 2 illustrates how oil-linkage as figured in Asia has given relatively higher prices than how linkage as calculated in Europe. The IEA expects this pattern of higher oil-linked prices in Asia to continue.
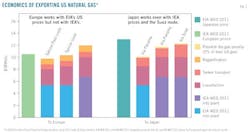
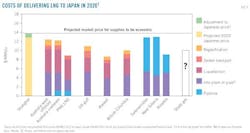
With these estimates and representative LNG transportation costs, it is possible to show hypothetical economics for Gulf Coast exports to Europe and Japan in 2020. Fig. 3 illustrates how sensitive European export economics are to US prices as well as how the Asian price premium over Europe tends to insulate Asian export economics from similar US price risks.
Margins on exports to Northwest Europe are also exposed to large market-price risks. The existence of gas-to-gas commodity competition in the UK, its pipeline links to the continent, and the EU's requirement for pipeline third-party access have made Northwest Europe a retail gas "combat zone." Long-term pipeline suppliers, such as Gazprom and Statoil, have been forced to meet commodity-price competition.
Asia (as well as some other LNG-dependent markets) has so far proved to be less vulnerable to LNG price competition. A key question then becomes, "How likely is it that competition to supply the Asian market will undermine that Asian price premium?"
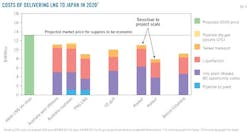
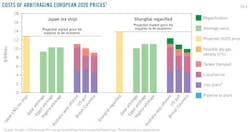
Figs. 4 and 5 illustrate that the supply economics for some of the largest competitive sources, particularly Australia, are high enough to provide some protection for the Asian premium.
A wild card is the potential for Chinese shale gas for which the Chinese are optimistic but whose costs are unproven.
Another potential LNG supply that could undermine Asian prices is the possibility of arbitraging the lower European prices via some other LNG exporter. While Qatar has the potential to do so, it seems so far to be more interested in preserving the existing price level than in discounting for market share.
But suppliers in North and West Africa could also be price spoilers. Fig. 6 illustrates the economics of three potential arbitragers, using the spread between the IEA's European and Japanese prices for 2020.
References
1. World Energy Outlook 2011; Geneva: International Energy Agency; p. 64, Table 1.4.
2. Annual Energy Outlook 2011; Washington: US Energy Information Administration; p. 29, Table A14.
The author

Manuscripts welcomeOil & Gas Journal welcomes for publication consideration manuscripts about exploration and development, drilling, production, pipelines, LNG, and processing (refining, petrochemicals, and gas processing). These may be highly technical in nature and appeal or they may be more analytical by way of examining oil and natural gas supply, demand, and markets. OGJ accepts exclusive articles as well as manuscripts adapted from oral and poster presentations. An Author Guide is available at www.ogj.com, click "Submit an article." Or, contact the Chief Technology Editor ([email protected]; 713/963-6230; or, fax 713/963-6282), Oil & Gas Journal, 1455 West Loop South, Suite 400, Houston TX 77027 USA. |