IMPROVED GAS RECOVERY—2 (Conclusion): Productivity increase using hydraulic fracturing—expectation vs. reality
Zillur Rahim
Hamoud Al-Anazi
Adnan Al-Kanaan
Ali Habbtar
Ahmed Al-Omair
Saudi Aramco
Dhahran
This is the second of two parts on the use of hydraulic fracturing to facilitate and enhance the gas recovery process from conventional and tight gas reservoirs.
Although most moderate and tight gas wells are treated with hydraulic fracturing on a routine basis, it takes tremendous effort to optimize and conduct successful fracture treatments where effective multiple fractures are placed in the reservoir and the posttreatment rates fall within expectation.
The fracture design that is expected to improve the well rate by a certain factor must consider the "true fracture" dimensions and conductivity that ultimately contribute to flow increase. There may be numerous reasons and factors that stimulation treatments will not work as designed and envisioned, resulting in the underperformance of a well. These factors and related remedies are addressed in the following sections.
Fracture dimensions
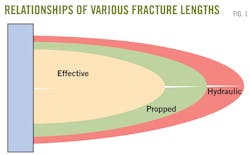
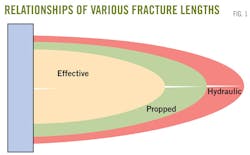
An important parameter in fracture dimension, other than fracture conductivity, is the effective fracture length (Xe) that contributes to well performance (Fig. 1).
Large discrepancies in fracture half-lengths among created fractures (also known as hydraulic fracture length, Xh), propped fracture (Xp), and Xe can cause the postfracture rate to be lower than predicted.6 The created fracture is the fracture volume generated during the pumping based on the fluid volume balance (Vpump – Vloss) reached at the end of the job with the shutting down of the injection pumps.
The propped fracture depends on the created volume and the pumped proppant mass. With good proppant transport and fluid quality assurance, a simple mass balance can provide approximate fracture area coverage by the proppant, provided the correct stress profile and Young's modulus are used to calculate the fracture height and width.
The effective fracture geometry, which is the most important parameter that dictates the posttreatment rate of the well, not only depends on proppant placement but also on cleanup efficiency, residual gel damage, and proppant conductivity reduction due to embedment or crushing. An optimal fracturing job therefore requires scrupulous quality control and thorough poststimulation cleanup.
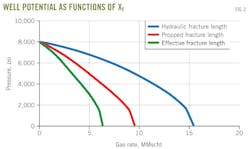
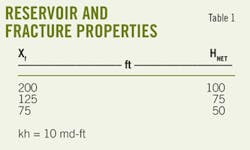
The well performance is directly proportional to effective fracture geometry. Fig. 1 illustrates a possible scenario that generally occurs where Xh >Xp >Xe. The IPR plots illustrated in Fig. 2 corresponding to the reservoir and fracture properties (Table 1) show how fracture half-lengths affect production rate. The impact of the effective fracture length on well performance is more pronounced in low permeability wells.
Good proppant transport example, Well-D
Well-D, drilled in a good permeability sandstone reservoir, was successfully fractured with 220,000 lb of proppant.
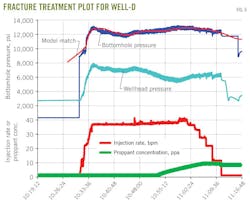
The job went as per design, and a posttreatment stabilized rate of 25 MMscfd was achieved (Fig. 3). The pressure buildup test presented in Fig. 4 indicated near-infinite fracture conductivity with 200 ft of effective half-length. The treatment pressure match using a hydraulic fracture model showed a propped fracture half-length of 250 ft.
This is an excellent example where the effective fracture half-length is comparable with the propped fracture half-length that is derived from pressure match and mass balance, thereby the expected rate performance compared closely with the actual performance of the well. Figs. 5 and 6 present the propped fracture geometry and the injection pressure match for Well-D.
Fracturing fluids
Fluid compatibility is a key issue addressed in the final fracture design.
Partially deteriorated or incompatible fluids, underdesigned fluid additives, use of higher polymer loading than required, and some other critical factors can cause formation damage, fracture conductivity reduction, or premature screen out, all leading to loss of well potential.
The most important factors to be considered in selecting fluids are: fluid loss properties, fluid stability under reservoir conditions (temperature and pressure), compatibility with formation fluids, friction loss, regained permeability (formation damage), proppant transport capability, and final fracture conductivity. More than 50 fracturing fluids are available to address different reservoir issues during stimulation. The main types are provided in Table 2.8
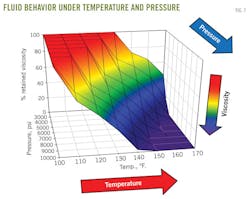
Pumping pressures encountered during fracturing can degrade borate cross-link fluid viscosity.9 The loss in fluid integrity can be negligible to complete, depending on the fluid formulation, temperature, and pressure. The most recent study shows the loss of fluid viscosity as functions of pressure and temperature (Fig. 7). It is therefore important to consider such rheology behavior while selecting the fluid per functions of reservoir and pumping conditions.
Pump volume of each stage is optimized based on reservoir properties, proppant volume, and concentration. The pad volume depends on the leak-off and must generate enough width before proppant reaches the fracture. Insufficient pad volume or rapidly degrading fluid at reservoir conditions will cause premature screen out. Overdesigning the flush stage with the intent to displace all proppant from wellbore into the fracture will lead poor wellbore-fracture connectivity and thereby will greatly reduce gas flow.
Postfracture cleanup
Excellent fracture fluid cleanup is required to restore proppant conductivity; otherwise it will lead to damage in the proppant pack and significantly decrease well productivity.
The cleanup process can be improved with the use of (1) good fluid recipe (low gel loading and cross-linker concentration in addition to sufficient breaker and surfactants), and (2) quick cleanup practices after the treatment is over. If a well is not cleaned up properly, significant gel damage may occur and proppant conductivity will be reduced permanently.
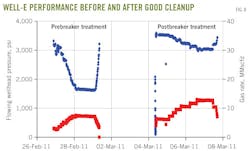
Fig. 8 presents well performance profiles of an actual example of a well (Well-E) drilled in tight sandstone and the initial cleanup after fracture treatment was not sufficient.6 The well performance was gauged against reservoir characteristics and expected fracture geometry, and it was immediately concluded that the actual rate was below expectation.
Since the fracture treatment was pumped as designed, it was suspected that the proppant pack was damaged due to insufficient cleanup of the well. Consequently, a much stronger live gel breaker at a higher concentration along with surfactant was reinjected into the well.
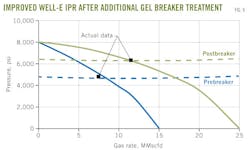
After waiting for the reaction to occur, the well was opened for cleanup. At this time, a much higher rate at a higher wellhead pressure was obtained that was comparable to the expected well performance. Both pre- and postbreaker performance points were matched, which showed, in Fig. 9, that well IPR was more than doubled from the treatment.
This actual example illustrates the two major components of a well stimulation process: (a) good estimation of well performance that requires proper knowledge of the reservoir and fracture properties, and (b) identification of the cause of the problem (in case the well performance falls below expectation), determining remedial actions, and applying necessary treatment to restore productivity.
A similar problem happened with Well-F where the well rate fell well below predicted postfracture performance. Similar to Well-D of the previous example, Well-F was drilled vertically in a low permeability interval and was successfully perforated and fractured with 250,000 lb of proppant.
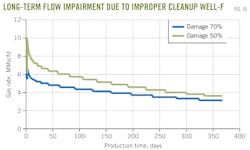
The initial postfracture test rate was matched with a numerical simulator by reducing proppant conductivity by 73%. This reduction in proppant conductivity is caused by the residual gel damage that did not flow back to surface during cleanup. Fig. 10 presents 1-year gas rate profile with 70% and 50% loss of proppant conductivity.6 10 In actuality, the industry average for proppant conductivity after successful treatment and cleanup is about 80% of theoretical permeability.
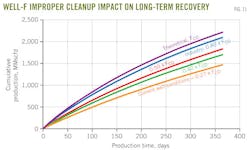
This means that conductivity degradation due to gel damage or any other factor of 20% is within the tolerance criterion. Fig. 11 shows that in a 1-year period, about 25% gain in cumulative production can be achieved if Well-B is initially cleaned up and had 80% of its proppant conductivity restored.
Selection of perforation interval
Improper placement of perforations can cause the fracture to grow outside the reservoir interval. For indirect fracture treatments often chosen to avoid perforating high sanding intervals, perforations are sometimes placed above the zone of interest to avoid sanding.
In such cases, high net pressure at the end of pumping must be built to maintain connectivity of the perforated interval with the main gas section and avoid creating pinchouts due to proppant settlement.
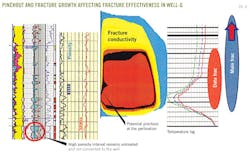
An example provided in Fig. 12 (Well-G) shows that although the fracture propagated below the perforations and covered some of the high porosity intervals, the pinchout in the perforated interval is due to proppant settlement.6 This is due to the high stress in the perforated interval as well as low net pressure achieved at the end of the job, resulting in insufficient packing of the proppant.
The decreasing pressure response observed in the pump pressure profile also indicates fracture height growth, in this case more in the upward direction, thereby causing more proppant to be lost in the nonproductive zone. The bottommost two higher permeability intervals indicated in the figure were not covered by the fracture.
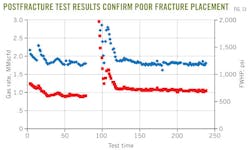
Although the entire treatment was successfully pumped placing all the proppant inside the formation, the well only produced about 1 MMscfd, much below expectation as presented in Fig. 13.
To overcome the poor well performance, remedial action to retreat the reservoir is being designed. For indirect fracture treatments, perforations placed below the zone of interest is usually a better option.6 In this scenario, even with the proppant settlement, the connection of the fracture with the nonperforated higher productivity zone is better maintained.
Wellbore trajectory
Wells that are drilled parallel to σmax will not favor creation of transverse or orthogonal fractures.
In such a case, the number of hydraulic fractures to be created is reduced significantly. That is because when a well is placed along the maximum in situ stress direction, the induced fractures are also created in the same direction, thereby limiting the number of independent fractures that can be realistically placed without one fracture overlapping the adjacent one.
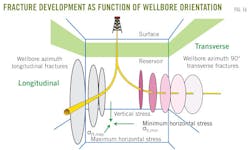
It is therefore conceivable that between two and four fractures can be placed longitudinally in a wellbore that is more than 1,000 ft long while there is practically no limitation of the number of orthogonal fractures generated from wellbores perpendicular to σmax as depicted in Fig. 11. Subsequently, the optimal number of fractures is not necessarily the largest number, rather it is dictated by the reservoir flow capacity, wellbore trajectory, reservoir contact, and completion limitation.
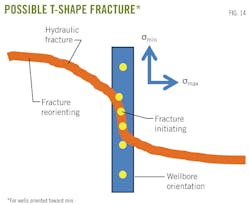
The well azimuth and inclination may impact the fracture initiation pressure. When a wellbore is drilled in the direction of the least horizontal stress, T-shaped fractures are likely to occur (Fig. 14). This is because of the tensile zone created around the wellbore in the direction of σmax causing the fracture to initiate in σmin direction. Soon, however, the fracture turns, the propagating axis changes, and fracture develops toward σmax direction.
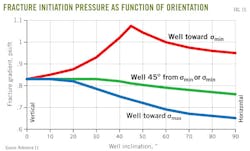
Fig. 15 shows that the maximum initiation pressure is reached in a well that is 45° deviated and drilled toward σmin.11 A 15% increase in breakdown pressure can occur for a horizontal well drilled toward σmin over a vertical well. Proper tubular ratings are therefore needed to fracture the high stress formation with horizontal wells with an azimuth toward σmin.
The fracture orientation with reference to the wellbore is presented schematically in Fig. 16. It should be noted that to maximize production from horizontal wells with multiple fractures, each fracture has to be of sufficient length and conductivity and needs to be properly cleaned up after treatment. The placement and total number of fractures should be such that interference occurring between fractures is minimized. This requires good reservoir knowledge, proper planning and design of fracture treatment, and its implementation. If placing more fractures causes interference, then the number of fractures should be optimized. Reservoir isotropy and homogeneity will impact well performance and ultimate recovery.
Conclusions and recommendations
1. In-depth reservoir characterization and optimal fracture design are needed to predict realistic gas rate and cumulative recovery.
2. The gap between expected well performance and what actually occurs can be minimized using an appropriate reservoir model, implementing good fracturing practices, and ensuring complete cleanup.
3. Selecting the correct fracture fluids is an essential part for a treatment to be successful. Correct gel loading, breaker concentration, and the addition of surfactants will enhance fluid flow-back after treatment.
4. Improper cleanup reduces fracture conductivity and can significantly impact well rate and recovery.
5. Sand jetting can sometimes be used to improve communication between the wellbore and the formation.
6. In indirect fracturing treatments, care must be taken to ensure good connectivity between fracture and wellbore. Pinchouts and proppant settlement will negatively impact the gas rate.
7. Multiple fracturing stages can be induced when wells are drilled toward the minimum in situ stress direction. Higher fracture initiation pressure can be expected in such a configuration.
Acknowledgment
The authors thank Saudi Aramco management for permission to publish this article.
References
1. Holditch, S., Perry, K., and Lee, J., "Unconventional Gas Reservoirs—Tight Gas, Coal Seams, and Shales," Topic Paper, NPC Global Oil and Gas Study, July 2007.
2. Holditch, S., "Hydraulic Fracturing: Overviews, Trends, Issues," published in Drilling Contractor, July/August 2007.
3. Al-Anazi, H.A., Okasha, T.M., Haas, M.D., Ginest, N.H., and Al-Faifi, M.G., "Impact of Completion Fluids on Productivity in Gas/Condensate Reservoirs," paper SPE 131078 presented at the SPE Middle East Oil and Gas Show and Conference, Mar. 20-23, 2011, Manama, Bahrain.
4. Surjaatmadja, J.B., Abass, H.H., and Brumley, J.L., "Elimination of Near-Wellbore Tortuosities by Means of Hydrojetting," paper SPE 28761 presented at the Asia Pacific Oil and Gas Conference, Melbourne, Nov. 7-10, 1994.
5. Rahim, Z., Al-Kanaan, A., and Al-Anazi, H., "Comprehensive Parametric Study of Optimal Well Configuration for Improved Gas Rate and Recovery," paper SPE SAS-59 submitted to the Annual Technical Conference, Saudi Arabian Section, al-Khobar, Saudi Arabia, Apr. 8-11, 2012.
6. GRMD internal well documentation and report.
7. Personal communication with Stephen A. Holditch.
8. Service company documentations.
9. England, K.W., and Parris, M.D., "The Unexpected Rheological Behavior of Borate-Crosslinked Gels," paper SPE 140400 presented at the SPE Hydraulic Fracturing Technology Conference and Exhibition, The Woodlands, Tex., Jan. 24-26, 2011.
10. Collaboration with Halliburton Services.
11. Baree, B., "Perforation for Stimulation" (www.baree.net/Fracture_Advances/).
Correction
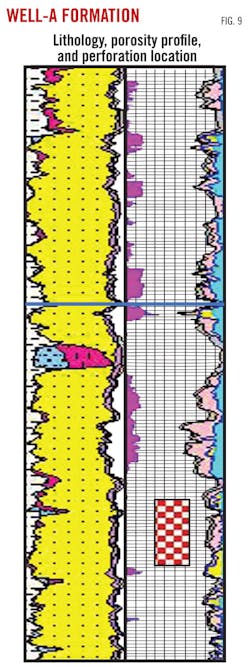
Fig. 9 appeared pixellated in Part 1 of the Improved Gas Recovery series by Rahim et al., "Maximizing postfrac gas flow rates from conventional, tight reservoirs" (OGJ, Mar. 5, 2012, p. 76). The corrected figure is shown below.
