Global biofuels will struggle to match ambitious objectives
James K. Fallon
Purvin & Gertz
Houston
When the US Energy Information Administration (EIA) published the September 2011 edition of its Petroleum Supply Monthly, it marked the sixth month out of the previous 9 in which the US was a net exporter of refined products.1 Industry observers were quick to recognize the distinctive shift this represented in finished-fuel trade patterns with 2011 establishing itself as the first time in 62 years the US was a net petroleum product exporter.
A contributing factor to this historic shift has been the rapid profusion of ethanol and biodiesel into the transportation-fuels mixture. Brazil, long considered the model for a national biofuels program, has been eclipsed in the last 10 years by the US as the dominant player in the worldwide ethanol market.
With biofuels now firmly established as a contributor to global transportation fuel supply, this article will analyze growth trends and ongoing governmental policy decisions in determining the percentage of market share that biofuels will occupy by 2022.
US ethanol demand growth
The rapid growth of ethanol use as a transportation fuel has largely been driven by blending mandates and supplemented by government subsidies and high crude oil prices. Ethanol initially found inclusion in the US blend pool as an oxygenate substitute during the selective methyl tertiary butyl ether (MTBE) phase-out that began in California in the early 2000s (OGJ, Jan. 14, 2002, p. 18).
Creation of the Volumetric Ethanol Excise Tax Credit (VEETC), which arose from the 2004 passage of the American Jobs Creation Act, provided the first official federal government stimulus (OGJ, Oct. 12, 2009, p. 24). This was subsequently followed by the Energy Policy Act of 2005 and the Energy Independence and Security Act (EISA) of 2007, establishing the Renewable Fuel Standard (RFS) 1 and 2, respectively.
The impact of these government policies and of comparable European Union measures has transformed the biofuels industry.
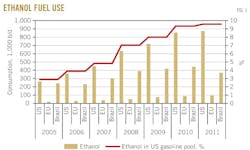
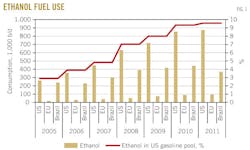
In 2000, Brazil accounted for 85% of all worldwide fuel ethanol usage; 10 years later US ethanol fuel consumption is over 100% greater than that of Brazil (Fig. 1).2 The rapid growth of the US fuel-ethanol industry has been more pronounced in the past year as the US has turned into a net exporter of fuel ethanol with Brazil, the EU, and Canada providing the primary outlets. Through 2011, net ethanol exports from the US have averaged about 45,000 b/d.3
This transition in the US from a net importer to exporter derives from various structural factors. The approach of the 10% blend wall for conventional gasoline grades and the limited retail infrastructure for E85 blends have constricted potential outlets for surplus ethanol production.
At the same time, the temporary suspension of the 20% import tariff into Brazil in April 2010, a lower-than-average Brazilian sugarcane harvest, and a low import tariff for high ethanol blends into the EU have provided outlets and financial incentives to keep US biorefineries operating at high utilization rates.4 This is despite lower overall domestic gasoline demand (ethanol and petroleum gasoline), down 6% from the 2007 peak.2
Underlying all of this is a high gasoline price associated with strong crude oil pricing.
If the full requirements of the 2007 EISA and RFS2 are achieved, a total 2.0-2.3 million b/d of ethanol from conventional and cellulosic sources will by 2022 be blended into the US gasoline pool.5 If this is achieved, factoring in such demand variables as projected population growth, increased vehicle efficiency, and percentage of diesel engines in the light vehicle fleet, Purvin & Gertz forecasts ethanol will supply about 25% of US gasoline demand by 2022.2
Despite a favorable political environment and general public acceptance of ethanol-blended gasoline, our analysis indicates that this level of ethanol blending is unlikely to occur. Purvin and Gertz projects blend volumes will peak then flatten at an inclusion rate of 13-14%.2
Technical barriers to blending
The largest impediment to achieving this US policy objective is that roughly half of the 2.2 million b/d would need to be derived from cellulosic and other advanced feedstock material, as required by RFS2. To be classified in either of these two categories, the total wheel-to-well greenhouse-gas reduction would have to exceed 50% vs. conventional petroleum gasoline, including indirect land-use effects associated with the biofuels feedstock.5
EIA has projected that 6.6 million gal of cellulosic ethanol will have been produced in 2011, none on a commercial scale and short of the original RFS2 target of 250 million gal. The 2012 RFS2 update (released December 2011) sets a cellulosic biofuel inclusion volume of 8.65 million gal (<600 b/d), which is a downward revision from the original 2012 RFS2 cellulosic target of 500 million gal.5Compound growth of 115%/year is necessary to achieve the mandated level of 1.1 million b/d of cellulosic ethanol by 2022, an improbable achievement given the pace of advancement to date, the scale of commercialization required, and financial hurdles.
One of the primary approved pathways for production of cellulosic biofuels is thermochemical, involving gasification and catalytic synthesis. This is a production process more closely resembling gas-to-liquids and coal-to-liquids and an order of magnitude more capital intensive than a conventional wet or dry milling commercial scale corn-ethanol plant.
The other main branch of the cellulosic ethanol technology tree is biochemical, which focuses on developing next-generation enzymes that can efficiently convert lignocellulose into sugar and then fermentation into alcohol. At present, a cost-effective microorganism capable of carrying out this process has yet to be discovered, research and development efforts in genetic engineering being viewed as critical to stimulating this technological breakthrough.
In a hypothetical analysis, if RFS2 were modified to enable traditional corn ethanol to achieve the full 2.2-million-b/d target, this too would prove difficult. At current crop yields of 440 gal/acre of planted corn, 120,000 sq miles of US crop and pastureland would be required to produce 2.2 million b/d of corn ethanol, an area 90% the size of Nebraska and Iowa combined and encompassing 20% of all US crop and pastureland, according to the 2007 USDA survey.6 7
Closer analysis of the data reveals that 15% of total world corn harvest went to produce 850,000 b/d of US ethanol in 2010,8 or roughly the amount of corn required to feed a population the size of the US, on a caloric basis. At 2.2 million b/d, the amount of corn required to produce that volume of ethanol would take up a large share of world corn production and significantly affect world food supply and demand balance.
It should be noted that only one third of every US-harvested corn bushel goes to produce transportation-fuel ethanol with an additional third going to produce animal feed byproducts and corn oil, both part of the modern food chain. The remaining third is lost as inedible and at present unconvertible waste and water removed as part of the distillation and purification process.9
Commercial barriers to blending
There are two structural variables to the US corn-ethanol industry likely to slow total market penetration. The first is the Dec. 31, 2011, expiration of the $0.45/gal VEETC legislation to extend the credit; it has not progressed through the US Congress and reinstatement now appears unlikely. The economic question is which among the major stakeholders that include corn producers, ethanol refiners, and wholesale blending and distribution outlets will be able to pass the additional cost burden onto consumers?
Based on the current interconnectivity between ethanol and conventional gasoline markets and the fact that petroleum refiners are unaffected by this legislative change, it is unlikely to affect the wholesale price of blended E10 gasoline, since no additional cost is being passed on to 90% of the retail gallon.
Recent history has demonstrated that the wholesale rack price of fuel ethanol tracks most closely with the price of corn feedstock vs. petroleum gasoline. The net cash margin for ethanol refiners has been at breakeven regardless of high or low ethanol wholesale prices.
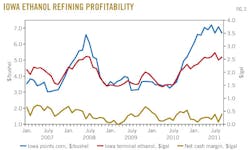
In Fig. 2 the net cash margin is calculated as the average of a wet and dry mill 100 million gal/year ethanol plant. Cash margin in Fig. 2 is calculated as terminal price plus the cost of ethanol byproducts (DDGS, gluten feed, meal, and crude corn oil) and less fixed operating costs, variable operating costs, and shelled corn feedstock.
Over this period, the capital-recovery factor has averaged 10% and 5% for a wet milling and dry milling operation, respectively. This is the bare sustainment level to provide incentive for reinvestment. Expiration of the tax credit removes support for ethanol refiners, and it is therefore realistic to assume a portion of these plants would move towards negative cash margins and subsequently shut down.
Closure of these marginal suppliers would impair the ability of US plants to supply the necessary volumes of ethanol to meet the RFS2 blending mandates for 2012–16. Purvin & Gertz believes that the corn-feedstock suppliers will absorb most of the increased costs associated with the removal of the tax credit and, to a lesser extent, the wholesale blending and marketing operations.
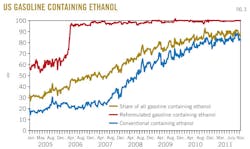
The second major impediment to increased market penetration of traditional corn-based ethanol is the convergence of blended ethanol with the 10% "blend wall" for all the major grades of gasoline (Fig. 3).
Specifically, the lack of comprehensive legislation providing product liability indemnification for E15 blends and higher in older model vehicles has provided a major hurdle to furthering acceptance within the marketplace today. As the older vehicle fleet is phased out of operation and given the legislative momentum behind higher proportion ethanol blends for mass distribution through the existing infrastructure, it is likely that in the next 5-7 years an E15 blend will become the standard for conventional and reformulated gasoline (RFG).
By 2018, this would increase the total ethanol blend volume in the US pool to 1.1 million b/d and will remain in the 13-15% blend concentration range for the foreseeable future.2
Another approach to increase ethanol use is through the branding and marketing of E85 blends for use in flex-fuel vehicles. This is similar to the Brazilian approach of offering both anhydrous ethanol blended with conventional gasoline and hydrous pure ethanol blends at most retail outlets.
Aside from the lack of adequate wholesale distribution infrastructure in the US and a general weariness by retail owners for further capital expenditure, the main challenge for widespread adoption will be the energy content differences between E85 and conventional gasoline. While the typical driver is unlikely to notice the difference between total tank mileage of 430 miles vs. 400 miles (E0 vs. E10), the fall off to 300 miles (E85) would be obvious.
Ethanol plant-gate prices for large volumes of E85 would no longer be a function of ethanol's gasoline extender value but would be on a btu-equivalency basis, or roughly $0.70-0.80/gal less than E10 blends. With the proper tax incentives and direct government investment in E85 infrastructure, there is a marketplace use for E85 as an outlet for excess production.
In the event of a bumper crop corn harvest or if trade barriers into certain markets outside the US become more restrictive, an E85 outlet would provide support during corn ethanol low-margin environments. As a standalone product, many ethanol refiners would not be able to deliver a positive return on investment by selling their ethanol product at a 25% discount to conventional gasoline.
Recent regulatory developments
Adding to the wide array of ethanol-related legislation on the docket is the adoption in November last year of a low-carbon fuel standard (LCFS) in California and the potential adoption of similar regulations throughout the US East and West coasts. In its simplest form the California LCFS attempts to force a phased reduction in the total lifecycle carbon intensity of transportation fuels by at least 10% over the next 8 years.10 Only approved pathways can result in the generation of low-carbon fuel credits.
A key aspect of this new regulation is that, as it currently stands, Midwest corn ethanol has equivalent carbon intensity with petroleum-based gasoline and as such offers no carbon-reduction benefits. This is primarily a function of the transport distance from the Midwest to California, the manufacturing intensity of ethanol from corn, and the percentage of coal in the Midwest electric generating mix that is used during production.
It should be noted that Brazilian sugar cane ethanol and conventional corn ethanol manufactured on the US West Coast do qualify as a low-carbon fuel under the standard.10
Given the apparent preference this provides to one source over another and the conflict this may pose with the Interstate Commerce Clause, a lengthy legal review process appears likely before the California LCFS becomes official. This preferential treatment has already been declared unconstitutional by the US District Court for Eastern California (OGJ, Jan. 9, 2012, p. 43).
If this LCFS were to go into effect as currently written, it may have the unintended consequence of reducing domestically produced ethanol demand as Brazilian ethanol is used in an attempt to meet the LCFS requirements.
A glut of ethanol in the Midwest and East Coast could drive prices down and reduce utilization in the US ethanol industry even as the overall RFS targets for advanced and cellulosic biofuels are being missed.
The December 2011 release of the 2012 update to RFS2 highlights some additional points of interest associated with US fuel ethanol policy.5 The actual physical volumes specified (as opposed to ethanol equivalent volumes) for the 2012 RFS are:
• 13.2 billion gal of cornstarch ethanol.
• 1.0 billion gal of biomass-based diesel.
• 8.65 million gal of cellulosic ethanol.
• 0.49 billion gal of unspecified advanced biofuels.
The 0.49 billion gal of unspecified advanced biofuel is important in that the only two commercially proven pathways with sufficient scale to provide this volume are additional biomass-based diesel and Brazil sugarcane ethanol. Assuming that Brazil sugarcane ethanol can provide the full volume of 0.49 billion gal, the total ethanol renewable fuel volume set by 2012 RFS2 is 13.7 billion gal.
Conventional petroleum-based gasoline demand for 2012 is projected by Purvin & Gertz at 7.9 million b/d (121 billion gal). Included in RFS2 is the small-refiner exemption that excludes 3.6% of all US gasoline production, making the included 2012 volume equal to 116. 5 billion gal. If the full volume of 13.7 billion gal were blended, ethanol would comprise 10.5% of the total volume, exceeding the 10% blend wall.
Data indicate that inclusion volumes of greater than 10% are already being blended in some US markets.11 Also of relevance is the base EPA assumption that up to 500 million gal of advanced biofuel is supplied from Brazilian sugarcane ethanol.5
Another outcome of the current LCFS policy is the likelihood of a sugarcane-based ethanol premium over corn-based ethanol. Traditionally, feedstock was not a determinate in the "quality" of ethanol, and in a given market the two ethanols carried a similar price.
LCFS, however, adds a premium value for lower-carbon ethanol, a premium that also extends to corn-based ethanol produced with lower lifecycle emissions (renewable power/energy used in the ethanol plant, lower transportation cost due to ethanol plant location, etc.).
Given our outlook for strong Brazilian gasoline demand and relatively tight Brazilian ethanol supply, a perfect storm would appear to be brewing around sugarcane-based ethanol pricing. Further, with expiration of ethanol import tariffs in both Brazil and the US and the premium that LCFS places on Brazilian sugarcane ethanol, 2012 may see establishment of an unusual trade pattern in which Brazilian ethanol flows into the US West Coast while US Midwest ethanol flows to Brazil.
Market penetration of fuel ethanol will slow substantially in the coming decade because of the myriad of political and financial hurdles currently under discussion. In addition, owing to mandates established by the RFS2 being heavily backend-loaded with advanced and cellulosic ethanol from technologies not commercially proven, market penetration of fuel ethanol will slow substantially in the coming decade.
We forecast total ethanol blended into the US gasoline pool will peak at 1.1 million b/d in 2018 and remain flat over the following 10 years, half the volume as established by the original RFS2 mandate.2 The majority of this production will be supplied with conventional corn-based ethanol, in spite of subsidies, tax incentives, and double-digit growth rates in the production volumes of advanced and cellulosic ethanol, assuming a yet-to-be-discovered technological breakthrough.
This increase of 250,000 b/d of additional ethanol into the blend pool, in combination with flat-to-declining gasoline demand, will exert additional margin pressure on struggling US refiners. As the ethanol-blend volumes increase, an additional contraction of 400,000 b/d of US domestic distillation capacity can be expected, most likely with the closure of two light sweet cracking configuration plants.
Global fuel ethanol outlook
European ethanol blending has increased rapidly in the last half of the past decade. This has arisen in a large part from the adoption of blending mandates by EU member states. Despite rapid growth, total ethanol volumes are modest at around 100,000 b/d.2 Where ethanol is included within gasoline blends, the typical blend percentage is 4-5%.2 The current macro-economic signals pointing towards a European recession, austerity measures, and adoption of more stringent carbon-intensity-reduction pathways will all place increasing pressure on refiners to meet defined renewable-fuel targets.
Most of the laggard countries in Europe in terms of biofuel inclusion are relatively minor fuels markets, and thus the growth rate of fuel-ethanol consumption seen over recent years will subside.
Brazil continues to rank second in total ethanol consumption, with 2011 Purvin & Gertz estimated volumes of both anhydrous ethanol added to conventional gasoline and neat hydrous ethanol totaling 390,000 b/d, or roughly 50% of all gasoline-engine consumption.4 Several poor sugarcane harvests and growing domestic consumption have applied short-term strain to Brazil's position as global swing provider of ethanol.
This is reflected in both the importation of US ethanol to supplement Brazilian domestic supplies and a lowering of the minimum blend volume of anhydrous ethanol in conventional gasoline to 18% from 20%.4 A slight restructuring of Brazil's ethanol program and the provision of additional incentives to increase sugarcane planting should help alleviate this short-term tightness, although it will be 24-30 months before the additional production volumes arrive at market.
For Asia-Pacific and other nations examining comprehensive ethanol policy as part of the transportation-fuel supply balance, programs to date appear to have lofty ambitions that have fallen short of goals or collided with the reality of food supply vs. fuel-security tradeoffs. Given the large populations of India and China and that most populous nations in the region, excluding Indonesia, have all been historical net food importers (China, India, Japan, South Korea), it is improbable that any of these countries will adopt large-scale blending programs on par with the US and Brazil.
The recent histories of India and China well illustrate the obstacles that many nations face when looking to adopt blending mandates. China appeared poised as the next major economic power to adopt a large ethanol-blending program. Total volumes have grown to 38,000 b/d in 2009, the third largest in the world, from zero production in 2003, punctuated with the commissioning of the 13,000-b/d Jilin plant, still the largest conventional fermentation ethanol plant in the world.12
Since 2009, however, growth of China's domestic ethanol blending program has stagnated, with no major commercial plants being commissioned. This revision to the central government plan appears to respond to civil discord in 2008 as citizens expressed outrage over converting a portion of their food supply into fuel.
China's government has since announced that future developments will only focus on feedstocks derived from non-edible sources.12 The recent announcement of construction of world-scale plants to convert coal to ethanol using a thermochemical process that focuses on supplying the industrial alcohol market and in any case has a markedly different carbon-intensity profile from fermentation-derived ethanol.
India with its large domestic sugarcane and molasses industry would appear to be ideal for adopting a large fuel-ethanol blending program as a means of supplying increasing transportation fuel demand. Since 2003, India has established national blending targets, typically between 5% and 10% of total gasoline consumption.
In no year since adopting these targets, however, has India achieved even 50% of the desired volumes.13 A combination of reasons have been cited including worse-than-expected sugarcane crop yield, complicated and inconsistent government incentives that do not make production of fuel ethanol economic easy, and competition from the industrial alcohol industry.
India's position as an historic net food importer makes wholesale implementation of a comprehensive biofuels program appear unlikely in the next 10 years.
This trend of actual biofuel blended volumes not matching ambitious national program objectives will likely continue in many parts of the world.
References
1. Petroleum Supply Monthly September 2011, US Department of Energy, Energy Information Administration, November 2011.
2. Global Petroleum Market Outlook, Purvin & Gertz, March 2011.
3. US International Trade Commission, http://dataweb.usitc.gov.
4. "GAIN Report Brazil Biofuels Annual 2011," US Department of Agriculture, Foreign Agricultural Services, July 2011.
5. "Regulation of Fuels & Fuel Additives: 2012 Renewable Fuels Standard," US Environmental Protection Agency, 40 CFR Part 80, December 2011.
6. "Ethanol and the 2010 Corn Crop," Renewable Fuels
7. "USDA Census of Agriculture 2007," US Department of Agriculture, 2007.
8. "USDA Grains: World Markets and Trade," US Department of Agriculture, November 2010.
9. "Ethanol Reshapes the Corn Market," USDA Economic Research Service, Amber Waves, Vol. 4, No. 2, December 2006.
10. "California Low Carbon Fuel Standard Regulation," CCR, Title 17, Sections 95480 through 95490, April 2009.
11. US DOE Energy Information Administration, http://www.eia.gov.
12. "GAIN Report China Biofuels Annual 2011," USDA Foreign Agricultural Services, July 2011.
13. "GAIN Report India Biofuels Annual 2011," USDA Foreign Agricultural Services, July 2011.
The author

More Oil & Gas Journal Current Issue Articles
More Oil & Gas Journal Archives Issue Articles
View Oil and Gas Articles on PennEnergy.com