US OLEFINS — SECOND-HALF 2011: US olefin production growth continues but more slowly
Dan Lippe
Petral Worldwide Inc.
Houston
Although pundits and politicians repeatedly tell us US economic growth slowed in third and fourth quarters 2011, gross domestic product statistics from the US Bureau of Economic Analysis contradict these opinions. In fact, BEA statistics showed quarter-to-quarter growth rates averaged 0.93% for third and fourth quarters 2011 vs. 0.87% for first and second quarters 2011.
For ethylene producers, microeconomic factors (such as downtime for turnarounds and trends in production costs from heavy feeds) rather than macroeconomic trends are frequently more important influences on short-term trends in ethylene production and profitability. Microeconomic factors were the keys to trends in ethylene production and profit margins during second-half 2011 vs. first-half 2011.
The important microeconomic considerations that influenced production included less capacity out of service for planned maintenance and turnarounds and less capacity out of service for unplanned operational problems during second-half 2011. The important microeconomic consideration that influenced production costs and profit margins was the increase in heavy-feed pricing especially during fourth-quarter 2011.
Feed slate trends
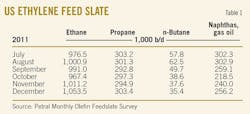
Petral monthly survey results showed ethylene industry demand for fresh feed averaged 1.63 million b/d for third-quarter 2011 but declined to 1.58 million b/d for fourth-quarter 2011. Demand for fresh feed in third-quarter 2011 was 24,800 b/d (1.5%) more than in third-quarter 2010 and demand in fourth-quarter 2011 was 49,000 b/d (3.2%) more than in fourth-quarter 2010.
Despite the increases during third and fourth quarters 2011 vs. 2010, demand for fresh feed remained 36,500 b/d (2.2%) lower than prerecession levels of first-half 2008. The shift to light feeds continued to limit total feedstock consumption, but ethylene production for second-half 2011 continued the recovery that began in first-quarter 2009.
According to Petral survey results, demand for LPG feeds (ethane, propane, and normal butane) averaged 1.35 million b/d during third and fourth quarters 2011. Demand for LPG feed was 31,300 b/d (2.4%) higher in third-quarter 2011 than in third-quarter 2010 and was 101,900 b/d (8.2%) higher in fourth-quarter 2011 than in fourth-quarter 2010.
Finally, demand for LPG feeds for second-half 2011 was 133,600 b/d (11%) more than prerecession levels of first-half 2008. LPG feeds accounted for 82% of total fresh feed in third-quarter 2011 and 85% in fourth-quarter 2011. LPG feed share of total fresh feed for fourth-quarter 2011 was a record high. For 2005-07, LPG feeds accounted for 70% total fresh feed.
Economics were consistently favorable for LPG feeds vs. heavy feeds during second-half 2011. As expected, ethylene producers further increased their use of ethane and reduced their use of heavy feeds. Ethane's share of total fresh feed was 61% during third-quarter 2011 and 64% during fourth-quarter 2011. Furthermore, operating rates for LPG crackers averaged 97% of capacity during third-quarter 2011 and 96% during fourth-quarter 2011.
Operating rates for multifeed plants were steady during third-quarter 2011 and averaged 88%. Operating rates declined during fourth-quarter 2011, however, due to turnarounds and averaged 85%. Finally, ethane accounted for 49% of fresh feed for multifeed plants during third-quarter 2011 and increased to 53% for fourth-quarter 2011 vs. 46% during first and second quarters 2011.
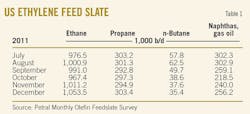
Table 1 summarizes trends in olefin plant fresh feed.
Although US economic growth was stronger in second-half 2011 than in first-half 2011, statistics published by the Foreign Trade Division of the US Bureau of Census showed exports of polyethylene and ethylene glycol in 2011 were less than in 2010.
The decline in exports indicates ethylene producers did not capitalize on production cost advantages to capture market share in international markets. Instead, ethylene producers met the needs of domestic customers. Most likely, trends in domestic demand for petrochemicals will remain a primary determinant of US ethylene production.
On this basis, Petral forecasts show US ethylene plants will operate at 88-90% of nameplate capacity during first-half 2012. Demand for fresh feed will average 1.60-1.65 million b/d during first and second quarters 2012. Demand for LPG feeds will average 1.30-1.35 million b/d during first and second quarters 2012, and ethane is forecast to continue to account for 62-64% of industry feed.
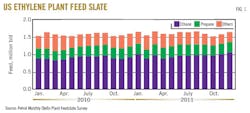
Fig. 1 shows historic trends in ethylene feed.
US ethylene production
Petral's survey results showed ethylene production from olefin plants averaged 148.6 million lb/day during third-quarter 2011 but declined to 144.8 million lb/day during fourth-quarter 2011. Ethylene production in third-quarter 2011 was 441 million lb (3.3%) more than in second-quarter 2011 and was 202 million lb (1.5%) more than in third-quarter 2010.
Production in fourth-quarter 2011 was 346 million lb (2.5%) less than in third-quarter 2011 but was 491 million lb (3.8%) more than in fourth-quarter 2010. Survey results showed downtime for turnarounds (a microeconomic factor) averaged 3.3 billion lb (5.5%) of industry nameplate capacity during fourth-quarter 2011 vs. 1.3 billion lb (2.2%) during third-quarter 2011. This microeconomic factor contributed to weaker pricing and profitability in fourth-quarter 2011.
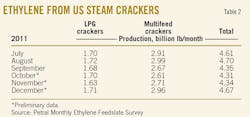
Petral survey results show ethylene production from LPG plants averaged 55.5 million lb/day for third-quarter 2011 and 54.8 million lb/day for fourth-quarter 2011. Production for third-quarter 2011 was 381 million lb (8.1%) more than in second-quarter 2011 and was 324 million lb (6.8%) more than in third-quarter 2010. Production for fourth-quarter 2011 was 61 million lb (1.2%) less than in third-quarter 2011 but was 316 million lb (6.7%) more than in fourth-quarter 2010.
Surprisingly, no LPG plants had downtime due to planned maintenance turnarounds during third and fourth quarters 2011 (another important microeconomic factor for the trend in production).
Ethylene production from multifeed plants averaged 93.1 million lb/day for third-quarter 2011 but declined to 90.0 million lb/day for fourth-quarter 2011. Production from multifeed plants during third-quarter 2011 was 61 million lb (0.7%) more than during second-quarter 2011 but was 122 million lb (1.4%) less than during second-quarter 2010. Production in fourth-quarter 2011 was 285 million lb (3.3%) less than in third-quarter 2011 but was 175 million lb (2.2%) more than in fourth-quarter 2010.
Table 2 summarizes trends in ethylene production.
As long as variable production costs based on ethane and propane remain less than costs based on light naphtha and other heavy feeds, ethylene producers will continue to operate LPG plants at full capacity rates during first and second quarters 2012 and will operate multifeed plants at lower rates to balance the market.
Fig. 2 shows trends in ethylene production.
US propylene production
EIA statistics show gas plant ethane production increased 66,000 b/d (8.1%) during third quarter and 90,000-100,000 b/d (11.2%) during fourth-quarter 2011. Consistent with the trend since fourth-quarter 2007, supply growth led to new record highs in ethane consumption, as a percent of total fresh feed and as a percent of fresh feed to multifeed plants.
Furthermore operating rates for multifeed plants declined during third-quarter 2011 vs. production rates in 2010; demand for heavy feeds was also 6,400 b/d (2.2%) less than in third-quarter 2010. Although operating rates for multifeed plants during fourth-quarter 2011 were more than in 2010, demand for heavy feeds was 53,000 b/d (18.2%) less than in fourth-quarter 2010. These microeconomic factors contributed to the ongoing decline in coproduct propylene supply.
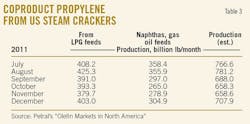
Coproduct supply (based on estimates derived from Petral feedstock survey results) declined in third and fourth quarters. Production averaged 24.3 million lb/day in third-quarter 2011 and 22.0 million lb/day in fourth-quarter 2011. Coproduct supply for third-quarter 2011 was 46.8 million lb (2.1%) less than for second-quarter 2011 and 35.5 million lb (1.6%) less for third-quarter 2010. Similarly, coproduct supply for fourth-quarter 2011 was 211.0 million lb less than for third-quarter 2011 (9.4%) and 139.2 million lb less than fourth-quarter 2010 (6.4%).
Propylene production from LPG feeds averaged 13.3 million lb/day in third-quarter 2011 and 12.8 million lb/day in fourth-quarter 2011. Production from LPG feeds in third-quarter 2011 was 6.2 million lb (0.5%) less than in third-quarter 2010. Production from LPG feeds in fourth-quarter 2011 was 26.4 million lb (2.3%) more than in fourth-quarter 2010; demand for propane was steady during fourth-quarter 2011, contrary to typical seasonal patterns.
Propylene production from heavy feeds increased in third-quarter 2011 and averaged 11 million lb/day but declined during fourth-quarter 2011 and averaged only 9.2 million lb/day. Production from heavy feeds in third-quarter 2011 was 29 million lb (2.8%) lower than in third-quarter 2010 and was 165 million lb (16.3%) lower than in fourth-quarter 2010.
Table 3 summarizes trends in coproduct propylene supply.
Refinery propylene supply
Refinery propylene sales into the merchant market are a function of fluid catalytic cracking unit feed rates, FCC unit operating severity, and economic incentives to sell propylene rather than use it as alkylate feed. Normally, refineries operate FCC units at higher levels during second and third quarters and reduce feed rates and operating severity during fourth and first quarters. Propylene yields from FCC units are generally lower when FCC units operate at lower severity.
EIA statistics indicate FCCU operating rates tracked the expected seasonal pattern. FCCU feed rates increased during third-quarter 2011 but declined during fourth-quarter 2011. EIA reported FCCU feed rates averaged 5.2 million b/d during third-quarter 2011 and were 201,000 b/d higher than during second-quarter 2011. Feed rates were also 165,000 b/d higher than in third-quarter 2010.
For the third-quarter 2011, FCCU feed averaged 33.5% of crude runs vs. 33.6% of crude runs during second-quarter 2011. In fourth-quarter 2011, based on EIA statistics for October and November and Petral estimates for December, FCCU feed averaged 4.76-4.80 million b/d and were 415,000-430,000 b/d lower than in third-quarter 2011.
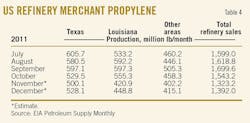
According to statistics from the US Energy Information Administration, without adjustments for overstatements, refinery-grade propylene production averaged 53.5 million lb/day in third-quarter 2011 Production was 2.05 million lb/day higher than in second-quarter 2011. Production averaged 48.5-49.0 million lb/day in fourth-quarter 2011 and was about 5 million lb/day less than in third-quarter 2011.
Analysis of EIA statistics for refinery-grade propylene and FCCU feed indicate misreporting again resulted in a supply overstatement of 1.1 million lb/day for third-quarter 2011 and 2.9 million lb/day for fourth-quarter 2011 (Table 4).
Based on EIA statistics (as published) for refinery-grade propylene and Petral estimates for coproduct supply, total US propylene supply increased in third-quarter 2011 and averaged 80.2 million lb/day, or 2.28 million lb/day (2.9%) higher than in second-quarter 2011. Total supply in third-quarter 2011 was also 5.7 million lb/day (7.7%) higher than in third-quarter 2010.
Petral's estimates for coproduct propylene production during fourth-quarter 2011 and EIA statistics for October and November 2011 indicate US propylene production in fourth-quarter 2011 declined and averaged 72.6 million lb/day. Production for fourth-quarter 2011 was 7.6 million lb/day (9.5%) lower than in third-quarter 2011 but was 3.1 million lb/day (4.4%) higher than in fourth-quarter 2010.
Fig. 3 presents trends in coproduct and refinery merchant propylene sales, as reported by EIA.
The propane dehydrogenation plant in the Houston Ship Channel produced an estimated 2.4-2.5 million lb/day during third-quarter 2011, but production slipped in fourth-quarter 2011 and averaged an estimated 2.05-2.15 million lb/day. At full capacity operations, Petral estimates production will average 3 million lb/day.
Feedstock prices, coproduct values, and ethylene plant yields determine ethylene production costs. Through direct contact with the olefin industry, Petral tracks historic trends in spot prices for ethylene and propylene. And it uses a variety of sources to track trends in feedstock prices. Some ethylene plants have the necessary process units to convert all coproducts to purity streams. Some ethylene plants, however, do not have the capability to upgrade mixed or crude streams of various coproducts and sell some or all their coproducts at discounted prices. Petral evaluates ethylene production costs in this article based on all coproducts valued at spot prices. |
Ethylene economics, pricing
Ethane and propane accounted for about 82% of total ethylene production in third and fourth quarters 2011. Industry's average production costs are increasingly determined by production costs for ethane and propane.
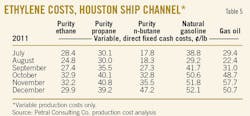
Production costs for ethylene in the Houston Ship Channel, assuming full spot prices for all co-products and based on purity ethane feeds, averaged 27¢/lb in third quarter. Production costs based on ethane for third-quarter 2011 were unchanged vs. second-quarter 2011 but were 10¢/lb higher than year-earlier costs. In third-quarter 2011, purity ethane provided ethylene producers with cost savings of 10¢/lb vs. light naphtha.
Production costs based on purity ethane increased to 32¢/lb in fourth-quarter 2011 and were 5¢/lb higher than during third-quarter 2011 and were 8¢/lb higher than during fourth-quarter 2010. Purity ethane provided producers with stronger economic incentives than during third-quarter 2011. Costs based on purity ethane were 18-22¢/lb lower than costs based on light naphtha.
Production costs for purity propane averaged 32¢/lb in third-quarter 2011. Costs were 6¢/lb higher than in second-quarter 2011 and 10¢/lb higher than in second-quarter 2010. Production costs increased to 40¢/lb for fourth-quarter 2011 and were 8¢/lb higher than for fourth-quarter 2010.
Variable production costs for propane were 5¢/lb higher than ethane for third-quarter 2011 and 8¢/lb higher for fourth-quarter 2011. Propane, however, provided ethylene producers with cost savings of 5¢/lb relative to light naphtha during third-quarter 2011 and 10-13¢/lb in fourth-quarter 2011.
Ethylene producers had weighted-average production costs of 26-29¢/lb for third-quarter 2011 and 32-35¢/lb for fourth-quarter 2011. Weighted-average variable production costs are based on 77% purity ethane and 23% purity propane for third and fourth quarters 2011. Production costs for light naphtha averaged 37¢/lb for third-quarter 2011 and jumped to 51.5¢/lb for fourth-quarter 2011.
Table 5 summarizes trends in ethylene production costs.
Ethylene pricing, margins
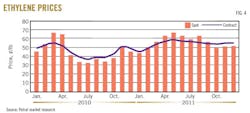
For third-quarter 2011, spot prices for ethylene averaged 59.5¢/lb, 4.9¢/lb lower than the average for second-quarter 2011, according to PetroChem Wire (www.petrochemwire.com). The contract benchmark averaged 55.6¢/lb for third-quarter 2011, 1.9¢/lb lower than in second-quarter 2011. Spot prices for ethylene declined during fourth-quarter 2011, averaging 50.5¢/lb or 9¢/lb lower than the average for third-quarter 2011. The contract benchmark, however, averaged 54.6¢/lb for fourth-quarter 2011, only 1¢/lb lower than in third-quarter 2011.
Petral survey results showed ethylene capacity downtime due to maintenance turnarounds averaged 4 billion lb for second-quarter 2011 but was only 1.3 billion lb for third-quarter 2011. Capacity downtime for turnarounds increased to an average of 3.3 billion lb for fourth-quarter 2011.
Spot prices for ethylene are normally discounted vs. nominal contract prices but downtime for turnarounds sparked a surge in spot prices. Spot prices jumped from a discount of 2.2¢/lb in January to a premium of 2.4¢/lb in March 2011. Price premiums in the spot market widened to about 7¢/lb during second-quarter 2011.
As ethylene producers completed turnarounds and production rates for third-quarter 2011 were 2.2% higher than for second-quarter 2011, spot-price premiums weakened to 4¢/lb for third-quarter 2011. Prices in the spot market reverted to discounts of 3-5¢/lb for fourth-quarter 2011.
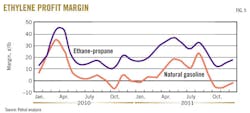
Margins based on the contract benchmark prices were weaker for ethane and propane in third-quarter 2011 than in second-quarter 2011 but were unchanged for natural gasoline. Margins based for purity ethane averaged 28.7¢/lb vs. 30.8¢/lb for second-quarter 2011.
Margins based on propane averaged 23.7¢/lb for third-quarter 2011, nearly 8¢/lb lower than in second-quarter 2011. Margins based on natural gasoline averaged 19.0¢/lb for third-quarter 2011 vs. 19.5¢/lb for second-quarter 2011.
For fourth-quarter 2011, margins based on contract benchmark prices for ethylene narrowed to 22.9¢/lb for ethane, 14.5¢/lb for propane and 3.1¢/lb for light naphtha. Contract benchmark prices clearly did not keep pace with higher production costs for heavy feeds and some ethylene producers curtailed operating rates as a result.
Fig. 4 illustrates historic trends in ethylene prices (spot prices and net transaction prices). Fig. 5 illustrates profit margins based on contract ethylene prices and composite production costs.
Refinery, polymer-grade propylene pricing
During third-quarter 2011, spot prices for refinery-grade propylene were nearly unchanged during July and August and averaged 68-69¢/lb vs. 71¢/lb in June. EIA statistics showed steady increases in refinery propylene inventory beginning in September. As a result, spot prices for refinery-grade propylene declined about 4¢/lb during September 2011, averaging 64-65¢/lb.
Spot prices for refinery-grade propylene averaged 67¢/lb for third-quarter 2011. The modest decline in spot prices during September was just the precursor to a full-scale price collapse during fourth-quarter 2011.
EIA weekly inventory reports showed refinery-grade propylene inventory ballooned to 1 billion lb at the end of December, 616 million lb (150%) higher than at the end of June. As the surge in inventory accelerated during fourth-quarter 2011, spot prices for refinery-grade propylene dropped 17¢/lb (26.2%) in October and continued to decline in November and December 2011. Spot prices averaged 38.9¢/lb in December, 43.8¢/lb for fourth-quarter 2011.
The premium for refinery-grade propylene prices vs. unleaded regular gasoline prices averaged 20.5¢/lb for third-quarter 2011 vs. 30.2¢/lb for second-quarter 2011. Premiums were 20.6¢/lb in September 2011 but collapsed to only 3.9¢/lb in October 2011, and spot prices for refinery-grade propylene were discounted by 2.4¢/lb in December 2011. For the fourth-quarter 2011, the premium vs. Gulf Coast unleaded regular gasoline averaged only 1.7¢/lb.
During third-quarter 2011, the contract benchmark for polymer-grade propylene averaged 78.0¢/lb, or 10.8¢/lb lower than the average for second-quarter 2011. The premium for polymer-grade propylene contract prices vs. spot refinery-grade propylene prices, however, widened to 11.0¢/lb in third-quarter 2011 from 9.7¢/lb for second-quarter 2011. During fourth-quarter 2011, the contract benchmark was almost 20¢/lb lower and averaged 59.3¢/lb. Premiums for polymer-grade propylene vs. refinery-grade propylene, however, continued to wide, averaging 15.5¢/lb for fourth-quarter 2011 and 17.1¢/lb in December 2011.
First-half 2012 outlook
Prices for dated Brent or Organization of Petroleum Exporting Countries basket prices are now reasonable alternatives to West Texas Intermediate crude as the basis for short-term price forecasts. Political instability in the Middle East and North Africa was an important bullish influence on crude oil prices during first-half 2011.
Abruptly, however, crude buyers and traders shifted their attention to the bearish implications of the Greek debt crisis, uncertainty about the future of the European Union, and the death of the Euro as an international currency during the second-half of 2011.
For 2012, crude buyers and traders face a similar dilemma and have to decide if bullish factors such as Iran's threat to block the Strait of Hormuz or unrest in Bahrain and Yemen will dominate price trends or if the brewing financial crisis in Europe will push global economies into another deep recession and undermine global growth in crude oil demand.
Despite Iran's threats during January 2012 to block the Strait of Hormuz, buyers and traders remained relatively calm and price trends for global crude oil benchmarks were only moderately bullish. Forecasts for first-half 2012 are based on the view that the bearish implications of the brewing financial crisis in Europe will eventually outweigh bullish concerns.
Benchmark crude oil prices are likely to fluctuate within a range of $105-115/bbl during first and second quarters 2012. Petral forecasts show prices for unleaded regular gasoline in the US Gulf Coast spot market will average 260-280¢/gal, full-range naphtha will average 250-270¢/gal, and gas oil will average 250-300¢/gal.
Petral forecasts also show variable ethylene production costs based on ethane and propane will decline during first and second quarters 2012 vs. fourth-quarter 2011. Variable production costs based on purity ethane will average 22-25¢/lb for first-quarter 2012 and 20-22¢/lb for second-quarter 2012. Variable production costs based on purity propane will average 22-28¢/lb during first-quarter 2012 and 18-22¢/lb for second-quarter 2012.
If spot prices for propylene, butadiene, and aromatics continue to strengthen as expected, variable production costs for natural gasoline will also decline and average 34-38¢/lb for first-quarter 2012 and 25-29¢/lb for second-quarter 2012.
Variable production costs for light naphtha have been an important consideration for spot ethylene prices since 2008. Bullish factors that pushed spot ethylene prices to 65¢/lb in second-quarter 2011 did not begin to unravel until September and margins based on natural gasoline averaged 19¢/lb higher for third-quarter 2011 but were sharply weaker in fourth-quarter 2011.
Variable production costs based on natural gasoline dropped 8¢/lb, and spot ethylene prices jumped to 58-60¢/lb in January 2012. Margins for natural gasoline improved to 7-8¢/lb. Scheduled downtime for turnarounds during second-quarter 2012 will again be above average, and Petral forecasts spot ethylene prices will remain strong during first and second quarters 2012 as the market anticipates ethylene supply-demand balances will be tighter than during fourth-quarter 2011. Spot ethylene prices will average 58-62¢/lb for first-quarter 2012 and 62-65¢/lb for second-quarter 2012.
Prices for refinery-grade propylene were below 40¢/lb during the first week of January but surged to 64¢/lb during the last few days of the month. Prices surged even though inventory remained at unusually high levels and perhaps in response to anticipation of a significant decline in coproduct supply due to turnarounds during second-quarter 2012.
Spot prices for refinery-grade propylene, however, rarely remain discounted vs. Gulf Coast gasoline prices; so the price rally in January occurred only a month or two sooner than expected. Petral forecasts spot prices for refinery-grade propylene will average 56-60¢/lb for first-quarter 2012 and 60-65¢/lb for second quarter. Premiums vs. Gulf Coast unleaded regular gasoline will average 10-12¢/lb for first-quarter 2012 and 18-22¢/lb for second quarter.
Petral forecasts polymer-grade propylene will average 62-65¢/lb during first-quarter 2012 and 68-72¢/lb during second quarter 2012. Forecasts for polymer-grade propylene are based on premiums of 7-95¢/lb vs. refinery-grade propylene. OGJ
The author
More Oil & Gas Journal Current Issue Articles
More Oil & Gas Journal Archives Issue Articles
View Oil and Gas Articles on PennEnergy.com
