Haynesville relaxes on cheap gas, draw of liquids plays, drill-outs

Mark J. Kaiser
Louisiana State University
Baton Rouge
This article highlights key information about the Haynesville shale play in northwest Louisiana from an OGJ Executive Report.
Haynesville production
Gas production in Louisiana had been on a steady decline for nearly 4 decades before Haynesville wells were brought on line (Fig. 1).
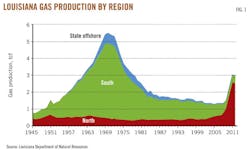
The first wells targeting the Haynesville were drilled in 2007 and within 3 years gas production in the state doubled. In 2011, the Haynesville produced 1.8 tcf gas, and in May 2012 more than 2,000 Haynesville wells were contributing nearly 70% of the state's total gas production (Fig. 2).

Over the past 2 years, however, record low gas prices, competition with liquid-rich resource plays, and fulfillment of contractual obligations have led to sharp declines in the number of wells drilled, and gas production in 2013 will fall from its recent peak, perhaps by as much as one-third as operators continue to retrench.
Spudded and completed wells
Exploration in the Haynesville shale began in 2007 with eight wells targeting the formation.
In 2008, 163 wells were spudded and 58 were completed, and in 2009, 540 wells were spudded and 351 completed (Table 1).
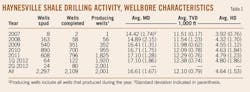
From 2007 through May 2012, a total of 2,297 wells were spudded and 2,109 completed. Wells may be completed during their spud year, but because of complex and lengthy multistage fracturing operations, there is usually a 6 to 12-month lag between drilling and completion activity.
Haynesville rig activity
Rigs drill wells, and active rig counts are a leading indicator of the number of wells drilled in the future.
Most rigs working the Haynesville are high spec, premium fixtures rated to 1,000-2,000+ hp drawworks, 3,000-4,800 hp mud pump capacity, and 20,000-35,000 ft vertical drilling depth. Using Smith Bit STATs, the number of horizontal gas rigs under contract from January 2008 through March 2012 was identified by working status in Bienville, Bossier, Caddo, DeSoto, Natchitoches, Red River, Sabine, and Webster parishes (Fig. 3). There was a steady increase in the number of active rigs in the Haynesville through the second quarter of 2010, and after a brief plateau, constant decline through the present time.

Drilling activity
Drilling activity tracks rig count and peaked in April 2010 at nearly 100 wells spud (Fig. 4). By April 2011, 60 wells were spudded, and by April 2012 fewer than 20 wells were drilled in the Haynesville.
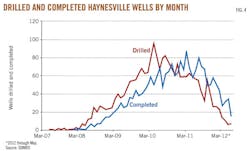
The combination of low gas prices, high well construction cost, and competition from liquid-rich shale plays are the primary reasons for the decline in capital invested in the region. Most of the Haynesville formation is thermally mature and contains only dry gas, offering no upside from liquid markets.
Marginal economics from the average well is another main factor for the drop-off in activity levels.
Well configuration
Most wells drilled in the Haynesville have a vertical depth of 11,000 to 12,500 ft and a measured depth of 16,000 to 17,500 ft (Fig. 5).

More than 85% of Haynesville wells have a horizontal displacement of between 4,000 and 5,500 ft and perforation interval between 3,500 and 5,000 ft (Fig. 6).

The average Haynesville well in 2012 was deeper, longer, and had a greater horizontal lateral than the first wells drilled in the formation (Table 1). Large variances in the horizontal displacement of wellbores reflect the different completion strategies of operators. Small differences in vertical depth indicate the relatively constant depth of the target formation.
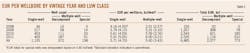
Well construction cost
Deep and long drilled intervals and highly pressured reservoirs contribute to high drilling cost, and laterals completed in soft rock with low Young's Modulus and a dozen or more stages contribute to high completion cost.
In 2010-11, less than 5% of wells spud cost more than $12.5 million to drill and complete compared with about 20% of wells in 2008. From 2008 to 2011, 60% of wells drilled and completed cost between $8 million and $11 million, 20% of wells cost $11-15 million, and 14% of wells cost $7-8 million. Completion expenses usually comprise more than half the cost of well construction.
The average cost of well construction in the Haynesville has not changed significantly from 2007-11, but the percentage of high cost wells has trended downward over time.
Haynesville success rate
Producing wells track drilled and completed wells closely, and high success rates reflect low discovery risk (Fig. 7).

Truly dry holes cannot be drilled within the boundaries of a continuous accumulation, but it is possible to drill wells that are not economic. Nine out of every 10 wells drilled in the Haynesville result in production. The recent drop-off in success rate is due to recently drilled wells that have not yet been completed.
Estimated ultimate recoveries
Using the producing well inventory in March 2012, ultimate recoveries were computed per wellbore and lease type using decline curve analysis (Table 2).
Production in Louisiana is reported monthly in terms of lease unit well (LUW) administrative codes and is due 60 days after the report month.
On multiple-well LUWs, production from two or more wells is aggregated, requiring specialized decomposition techniques to estimate individual well profiles. Average EUR per wellbore is computed as 5.7 bcf/well for single-well LUWs and 5.6 bcf/well for multiple-well LUWs.
Single-well LUWs completed in 2008 are expected to yield an average EUR of 4.2 bcf/well, and for those wells completed in 2009-11, 5.6-5.9 bcf/well. Multiple-well LUWs yield similar average recovery volumes per wellbore as one would expect if interaction effects are small, formations are relatively homogeneous, and completion designs do not vary greatly. From 2009 to 2011, EURs on multiple-well LUWs ranged from 5.3 to 6 bcf/well. There was no significant difference in the EUR distribution of single-well and multiple-well LUWs (Fig. 8).

Average EURs on both single-well and multiple-well LUWs have increased over time, which is likely the result of improved completion designs, identification of sweet spots in the formation, and operational changes (e.g., choking back production). EUR variation per LUW class is large and on-the-order of the mean, indicating significant variability in well recovery volumes.
Reserves inventory
Total EUR for the first quarter 2012 inventory of Haynesville wells is estimated to be 6.5 tcf on single-well LUWs, 2.1 tcf on multiple-well LUWs, and 773 bcf for special cases (Table 2).
When two or more wells on multiple-well LUWs come online within a short period of time of one another (less than 3 months or so), individual well profiles are difficult to distinguish which we refer to as special cases. Wells on multiwell LUWs not amenable to decline curve analysis are assumed to recover 5.6 bcf/well. Total expected recovery from all producing wells in the Haynesville circa March 2012 is estimated to be 9.4 tcf.
Development cost
Finding and development cost is one of the most common and widely reported performance measures used in evaluating the efficiency of adding new reserves to an operator's portfolio.
We assume a 25% royalty rate for all wells (i.e., 75% net revenue interest) and only consider well construction cost. "Finding" cost (i.e., seismic collection, processing, interpretation, science wells) are not considered.
About half of all wells drilled in the Haynesville realize development cost less than $3/Mcf, and 30% of wells fall between $3 and $6/Mcf. Only 6% of wells had development cost less than $1/Mcf. The average single-well development cost is $4.30/Mcf, and the average multiple-well development cost is $3.90/Mcf. The majority of high development cost cases were single-wells drilled in 2009-10.
Leading producers
The top five producers in the Haynesville in 2011 produced 80% of Haynesville production and held half of its proved reserves (Table 3).
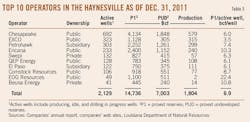
The top 10 operators produced 1.8 tcf and reported 14.7 tcf proved reserves and 7.0 tcf proved undeveloped reserves on Dec. 31, 2011.
Reserves disclosures
The 30 operators working the Haynesville in 2011 reported 20.7 tcf proved and 10.6 tcf proved undeveloped reserves.
Proved reserves for private companies were estimated using correlative relations derived from public company data. EUR estimates from the first quarter 2012 inventory of producing Haynesville wells (9.4 tcf) is consistent with proved developed reserves reported by operators (10.1 tcf). Differences in aggregation and modeling error are the primary factors responsible for the differences observed.
Recovery volume comparison
Chesapeake reported 4,134 bcf proved reserves from 692 active wells in the Haynesville on Dec. 31, 2011, or about 6 bcf/well (Table 3). Shell Western Exploration & Production Inc., QEP Energy, and El Paso's reserves per active well are also consistent with the 5.7 bcf/well computed average, providing confidence in the manner in which these companies book reserves.
EXCO is conservative (3.5 bcf/well), while Petrohawk, Encana, and Comstock fall slightly on the high end (7.4-10.3 bcf/well), and EOG Resources and Forest Oil appear highly optimistic (20+ bcf/well). Several private companies report average well recoveries from 14-17 bcf/well that are significantly higher than the average wellbore and may be due to optimism bias or reporting error.
The author

Mark J. Kaiser ([email protected]) is professor and director, research and development, at the Center for Energy Studies at Louisiana State University. His primary research interests are related to policy issues, modeling, and econometric studies in the energy industry. Kaiser holds a PhD in industrial engineering and operations research from Purdue University.