ALASKA IN-STATE PIPELINE—2 (Conclusion): Study finds in-state gas pipeline feasible
Zhenhua Rui
Independent Project Analysis Inc.
Ashburn, Va.
Analysis of Alaska natural gas supply and demand shows an Alaska in-state gas pipeline is critically needed. An LNG plant is also necessary for an Alaska in-state gas pipeline project to accommodate strong seasonal swings in Alaskan natural gas demand.
Based on forecast results from the simulation models, three flow rate scenarios produce reasonably low-cost natural gas for Fairbanks, Anchorage, and export markets. The first of this two-part series of articles (OGJ, Oct. 1, 2012, p. 112) examined factors influencing construction of an Alaskan in-state gas pipeline and the form such a project might eventually take. This second part will assess capital costs before discussing the modeling of the various throughput options for an in-state system.
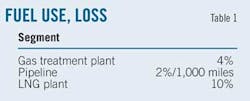
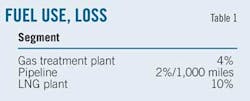
Fuel use, loss
Fuel use or loss is the amount of natural gas consumed by pipeline transportation, the gas treatment plant, and the LNG plant. Fuel use or losses are normally set as a percentage of the total volume of natural gas transported. Fuel use reduces the final quantity delivered, thus reducing revenue and increasing unit costs and tariffs. Table 1 shows the assumptions made regarding fuel loss for each process.
Tax, depreciation
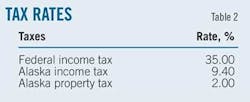
Income tax and property tax rates vary by region. Since an Alaska in-state gas pipeline would be in Alaska, typical Alaska tax rates are used. Table 2 shows potential taxes for Alaskan in-state gas pipeline models. The modified accelerated capital recovery system (MACRS) depreciates capital cost.
Financing structure
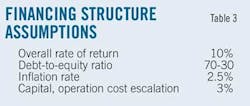
Financing structure includes overall rate of return, debt-to-equity ratio, inflation rate, and capital and operation cost escalation (Table 3).
Construction pattern
This article assumes project construction will begin in 2015 and last 3 years. The project will operate for 30 years.
Location cost
Pipeline and compressor station costs vary by region. Natural gas pipeline and compressor station costs in Alaska will be much higher than those in the Lower 48 states. Actual costs, however, for an Alaskan in-state gas pipeline are not publicly available.
Alaska is a unique state due to its geographic, climatic, economic, social, cultural, and lifestyle diversity. Transportation linkages and market-size efficiencies strongly influence the price of the same item in different locations.1 Importation of labor, severe climatic conditions, lower labor and machine efficiency, the large volumes of fill required, and the transportation cost for supplies and materials are most likely the main reasons railroad construction costs are higher in the Northern region of Alaska than elsewhere.2
Permafrost in Alaska causes major problems in pipeline construction. Roughly 75% of the proposed gas pipeline passes through continuous permafrost zones from ANS to the Brooks Range, then crosses discontinuous and sporadic zones before reaching Southcentral Alaska (Fig. 1). Permafrost causes three problems: frost heaving, frost jacking, and thaw settlement. Construction costs in permafrost zones are three to four times higher than under usual conditions, and operation costs increase accordingly.3
The three major design modes for building a gas pipeline in Alaska are aboveground pipeline, belowground pipeline with conventional burial, and belowground pipeline with special burial.4 Construction of the 800-mile, 48-in. OD Trans Alaska Pipeline System, moving oil from ANS to Valdez, occurred between Mar. 27 and May 31, 1977, at a total cost of $9 billion in 1977 dollars. Total costs exceeded budgeted costs by 4.53 times.5 6 About $800 million was spent elevating the 400-mile aboveground segment above the permafrost.6
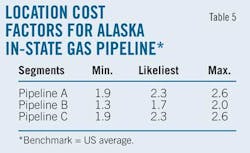
Table 4 shows some of the few available references for Alaskan location-cost factors. These references provide the basis for the location-cost factors used for the Alaskan in-state gas pipeline in this article (Table 5).
Methodology, software
The NERA model is the leveled tariff models shown in the accompanying equation. This model provided the basis to develop Alaskan in-state gas pipeline models with Monte Carlo simulations and new assumptions. A combination of function, formula, and data allows development of the relationship between input variables and output results.
Economic models comparatively analyzed three possible flow rate scenarios (500 MMcfd, 750 MMcfd, and 1,000 MMcfd) by assessing tariffs, capital costs, and taxes, all of which will change automatically by changing gas input quantity. Forecast results immediately demonstrate the differences between projects of varying flow rates.
For simplicity, this model uses 100% equity to evaluate the project, which makes it different from most real project financing. Since different investors have different financings, and each financing has different impacts on evaluating projects, it is much simpler to use a common figure to compare the projects at 100% equity.
Excel Crystal Ball software ran and analyzed the Monte Carlo simulations. Each uncertain input variable in a simulation receives a probability distribution. A simulation calculates the numerous scenarios of a model by randomly using values from the probability distribution of uncertain input variables. Crystal Ball categorizes distributions and associated scenarios of input variables as assumptions. Fig. 2 shows major distribution-type assumptions of Crystal Ball.
The historical distribution of variables guides the type of distribution selected. Analysis of cost overruns for historical pipeline and compressor station costs led to selection of the triangular distribution for this simulation.
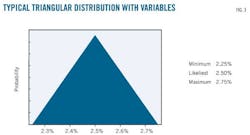
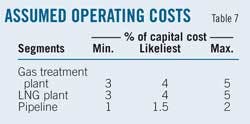
Fig. 3 shows an example of typical probability distributions of the input variables. The base represents the possible range of values, while the height of the triangle represents the probability of the value actually happening. The highest point of the triangle is the most likely value. Forecasting probability distributions of output variables proceeds accordingly. Variables from Tables 6 and 7 act as input for the Monte Carlo simulation models. Capital costs, taxes, and tariffs are forecast output.
Results, analysis
Taxes, tariffs, and capital costs provide the basis for evaluating the three flow rate scenarios. The base case (likeliest value) of estimated capital cost, tariff, and tax serves in the comparison.
Capital cost
Table 8 shows capital costs of each segment for different flow rates. Capital costs of the project increase with the input quantity of gas. For base case, the whole project capital cost increases from $3.59 billion to $6.879 billion as the quantity of gas increases from 500 MMcfd to 1,000 MMcfd. Unit cost/MMbtu decreases with flow rates (Table 9), but pipeline capital costs increase with flow rates.
Tax
Taxes for an Alaskan in-state gas pipeline include Alaskan state and US federal taxes. Table 10 shows the total tax amount recovered from the pipeline. Taxes accruable to both Alaska and the US increase with increased quantities of input gas. In the base case of this investigation, the 1,000 MMcfd pipeline generates the highest tax amount, $3.869 billion.
The larger flow rate case increases tax revenue for the government and tax costs for pipeline project investors or operators. From the government perspective, the 1,000-MMcfd project would be the best option with the highest tax revenue.
Tariff
Pipeline tariffs are the transportation costs for delivering natural gas to customers and are paid by the consumers of the natural gas. Pipeline tariffs in the US are regulated by the Federal Energy Regulatory Commission, with estimated tariffs based on the cost of the project and regulated rate of return. Tariff is the critical parameter for determining the market for an Alaskan in-state gas pipeline and the feasibility of such a project.
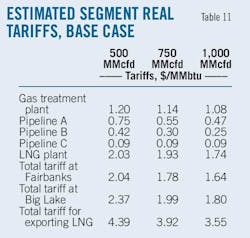
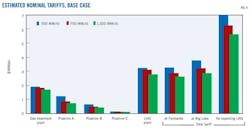
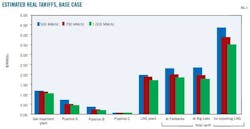
This article assumes a tariff distributed evenly during 30 years. Table 9 and Fig. 4 show the estimated nominal tariff for each segment by different flow rates. Table 11 and Fig. 5 demonstrate real tariffs for each segment in 2008 dollars (base case). The tariff for each segment decreases with increasing throughput. The lowest tariff case produces the best outcome for customers. Results show each of the three flow rate scenarios produces reasonable prices for the offtake locations.
Assumptions for this analysis at the 1,000 MMcfd flow rate (base case) include an assumed wellhead gas price of $2.00/MMbtu, assumed local distribution charges of $2.00/MMbtu, and additional tariffs from the Fairbanks straddle and offtake facility of about $1.90/MMbtu.7 The current estimated cost of natural gas to Fairbanks customers, however, is $7.54/MMbtu, and the estimated cost of natural gas to Anchorage customers is $5.80/MMbtu, making the price of gas from an in-state natural gas pipeline for Fairbanks and Anchorage customers much lower than what it is now.
The estimated export price for LNG is $7.55/MMbtu. The LNG shipping cost to Asia is roughly $0.80 to $1.40/MMbtu.8 Regasification cost is $0.50-1.00/MMbtu, plus a $0.25-0.50/MMbtu connection fee, making the final total price for exported LNG to Asia $9.30-10.65/MMbtu, a strong price advantage compared with forecast LNG prices in the Asian market of roughly $16.3/MMbtu (2008 dollars) (OGJ, Oct. 1, 2012, p. 112).
The 750 MMcfd and 1,000 MMcfd options may not be allowable under the 2007 Alaska Gasline Inducement Act (AGIA). AGIA sets the maximum flow rate for the in-state gasline at 500 MMcfd.9 Eliminating this limitation would make the in-state gas pipeline more feasible.
AGIA's $500 million state inducement may add extra cost to the in-state gas pipelines, but even with it the additional leveled tariff is only $0.06/MMbtu for the 750-MMcfd case and $0.05/MMbtu for the 1,000-MMcfd case. The 750-MMcfd and 1,000-MMcfd tariffs remain significantly lower than the 500-MMcfd case, with the 1,000-MMcfd case the most valuable option for customers.
Discussion
Enstar and AGDC estimated the capital cost of Alaskan in-state gas pipelines. For the 500-MMcfd flow rate, Enstar estimated capital cost between $3.83 billion and $4.57 billion (2009 dollars).10 AGDC estimated capital cost of the same pipeline sections at about $4.59 billion with an uncertainty of ±30% (2011 dollars).7 The estimated capital cost of the pipeline sections in this article range between $1.227 billion and $1.772 billion (2008 dollars).
Given consumer price index growth between 2008 and 2011 of only about 5%,11 the estimated capital costs of an in-state gas pipeline vary greatly among different studies. Drawing conclusions regarding which estimated costs are more accurate is difficult.
The estimated capital costs of the gas pipeline used in this article's underlying study are based on unit cost estimated from historical cost data for 412 pipelines and 220 compressor stations, as well as assumed location cost factors. The unit cost of pipelines with lengths between 100 miles and 713 miles ranges from $20,569/in./mile to $91,000/in./mile, with average unit cost of $36,000/in./mile (OGJ, July 4, 2011, p. 120; OGJ, Jan. 9, 2012, p. 110).
If the location cost factor is 2 for Alaskan gas pipelines, which is the highest reference number found in available literature, the estimated capital costs of an Alaskan in-state gas pipeline will range from $745 million to $3.222 billion; that's still lower than Enstar and AGDC's estimated costs. Since the cost sources of the Enstar and AGDC estimates are not publicly available, however, the cost differences cannot be directly examined and investigated.
Permafrost and Alaska's remoteness causes higher pipeline construction costs. None of the 412 historical pipelines and 220 compressors in this article's data set was built in Alaska, and there is no information showing that any was built on permafrost. Enstar and AGDC may have cost data about pipelines built on permafrost.
The selection of different location cost factors can significantly change total capital costs of pipeline projects. The location cost factor used in the study underlying this article may or may not be suitable. Future work, therefore, needs to concentrate on collecting more pipeline data from permafrost and remote sites in Alaska.
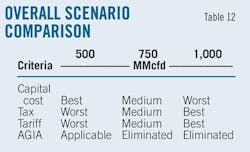
Table 12 compares the three scenarios in terms of capital cost, tax, tariff, and AGIA issues. The 1,000-MMcfd case provides the lowest cost natural gas to customers without considering AGIA and capital requirements. The 1,000-MMcfd project would also have the highest tax revenues and lowest tariffs. The 500-MMcfd case, however, is both allowable under AGIA and has the lowest capital cost.
[Note: Both parts of this article are based on PhD research conducted by the author at University of Alaska Fairbanks and not affiliated with Independent Project Analysis Inc.]
References
1. McDowell Group, "Alaska Geographic Differential Study 2008," Anchorage, Alas., 2009.
2. Clark, P.R., "Transportation Economics of Coal Resources of Northern Slope Coal Fields, Alaska," Report No. 31, Mineral Industry Research Laboratory, Fairbanks, Alaska, 1973.
3. Porfiryev, M.M., and Porjhayev, G.V., "Utility Networks in Permafrost Regions," Permafrost International Conference Proceedings, Lafayette, Ind., Nov. 11-15, 1965.
4. Alyeska Pipeline Service Co., http://www.alyeska-pipe.com/Default.asp, 2011
5. Merrow, E.W., McDonnell, L.M., and Arguden, R.Y., "Understanding the Outcomes of Megaprojects: A Quantitative Analysis of Very Large Civilian Projects," R-3560-PSSP, Rand Corp., Santa Monica, Calif., 1988.
6. Cole, H., Colonell, V., and Esch, D., "The economic impact and consequences of global climate change on Alaska's infrastructure," Assessing the Consequences of Climate Change for Alaska and Bering Sea Region: Proceeding of a Workshop at the University of Alaska, Fairbanks, Oct. 29-30, 1998.
7. Alaska Gasline Development Corp., "Alaska Stand-alone Gas Pipeline/ASAP," AGDC, Anchorage, Alas., 2011.
8. Alaska Gasline Development Corp., "Greenfield Liquefied Natural Gas (LNG) Economic Feasibility Study," AGDC, Anchorage, Alas., 2011.
9. Alaska Gas Pipeline project office, http://gasline.alaska.gov/, 2011.
10. Enstar, "Alaska In-state Gas Pipeline Project: Presentation to the Commercial Working Group," Anchorage, Alas., Dec. 15, 2009.
11. Bureau of Labor Statistics, http://www.bls.gov/cpi/, 2011.
