US PROPANE — FOURTH QUARTER 2012, FIRST QUARTER 2013: US, Canada flush with propane at winter's end; markets to adjust
Dan Lippe
Petral Consulting Co.
Houston
All major supply hubs in US and Canada had surplus inventory of propane at the end of winter 2011-12. Propane markets in North America are dynamic, however, and possess various mechanisms to accommodate surpluses and shortages.
Historically, feedstock flexibility was the most important of the various mechanisms. Specifically, ethylene plants in Texas and Louisiana have demonstrated the capability to vary propane consumption within a range of 200,000-400,000 b/d. A swing of 100,000 b/d translates into a cumulative change of 10 million bbl in 100 days.
In today's world, however, feedstock demand for ethane must increase at rates equal to the growth in gas plant production. This factor is imperative to maintain a balanced ethane market. To achieve this objective, ethane prices adjust as necessary, relative to all other feeds but especially to propane, and reduce the practical feasibility for large increases in feedstock demand as a balancing mechanism.
Historically, feedstock demand for propane is an important and predictable balancing element for the overall propane supply-demand equatiion in North America. When colder weather pushed sales and consumption in retail markets steadily higher, ethylene producers in the US Gulf Coast generally have reduced consumption; this change has effectively offset some of the impact of the seasonal increases in retail demand. These counter trends normally helped keep the overall market in balance. Similarly, as consumption in retail markets declined during March through June, feedstock demand generally recovered beginning in March or April. The inventory surplus at the end of March 2012 was sufficient to support 100,000-120,000 b/d of additional feedstock demand during second and third quarters 2012. The imperative to increase ethane consumption limited the upside in feedstock demand for propane. |
In addition, US Gulf Coast waterborne import and export terminals are another important mechanism for coping with supply-demand imbalances. Propane exports from Gulf Coast import-export terminals, however, reached refrigeration capacity constraints in January 2012, and there is no upside for waterborne exports until 2013.
NGL distribution system constraints are pervasive in today's NGL marketplace; we have to consider these constraints in assessing propane market trends. As a result, the effects of the mild 2011-12 winter continued to influence propane markets during second and third quarters 2012 and will continue to influence propane markets during winter 2012-13.
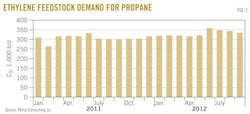
In second-quarter 2012, feedstock demand for propane was 330,800 b/d and was 11,900 b/d higher than in first-quarter 2012. The increase in feedstock demand in second-quarter 2012 was only 12% of the volume needed to bring inventory levels down to historic averages.
Demand averaged about 340,000 b/d in third-quarter 2012 and was 10,000 b/d higher than in second-quarter 2012. During 2006-10, propane's share of fresh feed for second and third quarters was 20% and the maximum was 22%. Propane's share of fresh feed was 22% in second-quarter 2012 vs. 20.5% in first-quarter 2012.
Propane was less expensive than all other feeds for about 6 weeks (May through mid-June) during second quarter, and propane's share of fresh feed increased to 23.3% in June. Ethane prices declined, and ethane was once again the less expensive feed (¢/lb ethylene) by mid-June. The variation in propane's share of fresh feed (21% in April-May, 23% in June, and 21% in July) demonstrated the importance of the imperative to maximize ethane consumption in today's market.
The increase in feedstock demand for propane during second and third quarters 2012 was the equivalent of 5.3 million bbl. This increase was a factor in preventing the inventory surplus from increasing further after the mild weather in winter 2011.
Table 1 summarizes trends in ethylene feedstock demand for propane.
We estimate total demand for fresh feed averaged 1.65 million b/d during third-quarter 2012, and we forecast total demand for fresh feed will average 1.60-1.65 million b/d during fourth-quarter 2012 and first-quarter 2013. Until the inventory levels return to historic averages, propane availability will be sufficient to support feedstock demand at current levels in fourth-quarter 2012.
Based on forecasts for ethylene production and total feed and average share of fresh feed, we forecast feedstock demand for propane will average 315,000-335,000 b/d during fourth-quarter 2012 and 300,000-320,000 b/d in first-quarter 2013.
Fig. 1 illustrates historic trends in ethylene feedstock demand for propane.
Exports
Prices for cargoes in international markets fell sharply during second-quarter 2012, but prices in Mont Belvieu fell in tandem. Prices in Mont Belvieu were discounted 60-70¢/gal vs. Saudi contract price in April and May and 52¢/gal in June. The deep discounts sustained waterborne exports at full rates during second and third quarters.
Data published by the US Census Bureau's Foreign Trade Division showed exports from Gulf Coast terminals reached 150,900 b/d in second-quarter 2012. We estimate exports from Gulf Coast terminals were 150,000-160,000 b/d in third-quarter 2012. Exports have been consistent at this level since January.
Foreign Trade Division statistics show US exports (including overland shipments to Mexico) were 164,000 b/d in second-quarter 2012 and 160,000-170,000 b/d in third-quarter 2012.
Propane exports in second and third quarters 2012 were almost 6 million bbl more than in 2011. Exports, at full capacity rates, helped limit further increases in the US inventory surplus. When Enterprise Products Co. and Targa Resources complete projects to increase loading rates for their LPG export terminals in the Houston Ship Channel (OGJ Online, May 4, 2006), LPG export capability will increase to 300,000 b/d.
If US waterborne propane exports had been only 50,000 b/d more during second and third quarters 2012, the inventory surplus at the beginning of winter 2012 would be only 10 million bbl, instead of 20 million bbl. The additional export capacity in 2013 will alleviate this distribution system constraint.
Prices in international markets jumped sharply beginning in late July and continued to increase during August and September. We expect incentives to load propane export cargoes will average 90-100¢/gal in fourth-quarter 2012. International LPG buyers and traders will continue to load cargoes at maximum rates in fourth-quarter 2012.
Propane supply
Based on data published by the US Energy Information Administration (EIA), total domestic production from gas plants and net propane production from refineries averaged 961,000 b/d in second-quarter 2012. Production in second-quarter 2012 was 73,100 b/d (6.6 million bbl) more than year-earlier volumes.
EIA data for July and estimates for August and September 2012 suggest total domestic production was 980,000-990,000 b/d in third-quarter 2012. Production in third-quarter 2012 was about 95,000 b/d (8.7 million bbl) more than year-earlier volumes.
Gas plants
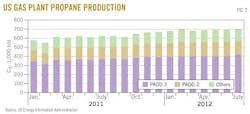
EIA statistics indicate that gas plants' propane production averaged 690,600 b/d in second-quarter 2012. Production was 76,700 b/d (7.0 million bbl) more than in second-quarter 2012 and accounted for all of the year-to-year increase in domestic production.
EIA statistics show gas plant production in July 2012 averaged 696,200 b/d. We estimate production averaged 695,000-705,000 b/d in third-quarter 2012 and was 80,000-85,000 b/d (about 7.6 million bbl) more than in third-quarter 2011.
Finally, we forecast gas plants' production will average 700,000-710,000 b/d during fourth-quarter 2012 and first-quarter 2013.
Fig. 2 shows trends in propane production from gas plants.
Refineries
For second-quarter 2012, EIA statistics showed propane production from refineries (net of propylene for propylene chemicals markets) was 270,300 b/d; net production was only 3,300 b/d more than in first-quarter 2012 but was 3,600 b/d less than in second-quarter 2011.
EIA statistics for July and Petral estimates for August and September indicate refinery propane production for third-quarter 2012 was 275,000-285,000 b/d. We forecast purity propane supply from refineries will average 265,000-275,000 b/d for fourth-quarter 2012 and first-quarter 2013.
Fig. 3 shows trends in total propane production (gas plants and refineries).
Data published by the Census Bureau's Foreign Trade Division for second-quarter 2012 showed imports at 71,800 b/d and imports from Canada at 54,600 b/d. Total imports were 10,400 b/d lower than year-earlier volumes, and imports from Canada in second-quarter 2012 were 10,200 b/d lower than year-earlier volumes. East Coast import terminals received 8,300 b/d of waterborne imports in second-quarter 2012 and were 9,100 b/d lowers than in 2011.
During 2006-08, propane imports from Canada typically averaged 75,000-90,000 b/d during second and third quarters. Imports from Canada during second and third quarters 2009-11 declined to 65,000-75,000 b/d. During 2006-08, waterborne deliveries to US East Coast terminals declined during second and third quarters and were 20,000-25,000 b/d. Waterborne imports through East Coast terminals during second and third quarters 2011 were 12,800 b/d. Growth in gas plants' production from NGL-rich gas in the Marcellus will continue to reduce the need for imports during second and third quarters. |
In third-quarter 2012, based on the same statistics for July and estimates for August and September, we estimate total imports were 95,000-105,000 b/d and were 15,000-25,000 b/d more than in third-quarter 2012. We estimate imports from Canada were about 85,000-95,000 b/d and waterborne imports through East Coast import terminals were 5,000-10,000 b/d.
Imports from Canada were about 15,000-25,000 b/d more in third-quarter 2012 than in 2011, and waterborne imports into East Coast terminals were about the same as in 2011.
Petral forecasts total imports into the US will average 145,000-155,000 b/d in fourth-quarter 2012 and 135,000-145,000 b/d in first-quarter 2013. We had thought the 20-million-bbl inventory surplus might discourage imports during second and third quarters 2012.
As expected, however, imports from Canada were nearly equal to historic averages. (Canadian marketers, particularly in western Canada, were aggressive in selling surplus inventory from Canadian storage.) Historically (2009-11), waterborne imports into East Coast terminals were 15,000-25,000 b/d in second quarter and were less than 15,000 b/d during third quarter.
Inventory trends
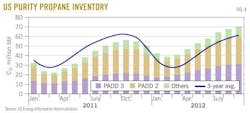
Propane inventory (excluding nonfuel propylene inventory included in EIA gross propane-propylene inventory data) in primary storage in the US was 40.9 million bbl on Apr. 1, 2012. EIA statistics from the Petroleum Supply Monthly showed inventory on Apr. 1 was 18.4 million bbl more than year-earlier volumes but was only 12.6 million bbl more than the 3-year average.
In a typical offseason (second and third quarters), inventory increases 34-35 million bbl, and the build was never less than 33.5 million bbl (2006-11). In 2005-06, inventory accumulation was 46.5 million bbl and 41.7 million bbl, respectively.
Based on EIA statistics published in Petroleum Supply Monthly (data through July) and its weekly survey results, we estimate inventory accumulation during offseason 2012 was about 32 million bbl. Inventory accumulation was 1.5 million bbl below average in May and 2.9 million bbl below average in June. Notably, feedstock demand was at its year-to-date high during May-June.
Inventory on Aug. 1 was 64.3 million bbl (EIA data from Petroleum Supply Monthly for July) and was 9.8 million bbl more than the 3-year average but 19.2 million bbl more than in 2011. The comparison with the 3-year average is more important than the comparison with 2011 because inventory in 2011 was consistently lower than historic averages from Feb. 1 through Dec. 1.
Inventory in Canada typically begins to increase in March and reaches its seasonal peak on Sept. 1 or Oct. 1. Seasonal accumulation rates were 7.9 million bbl in 2011 and 9.2-9.4 million bbl in 2009 and 2010. Canada's National Energy Board (NEB) statistics showed inventory in Canadian storage was 6.2 million bbl on Mar. 1 and 3.1 million bbl more than in 2011 and 3.0 million bbl more than the 3-year average.
Typical seasonal build rates suggest Canadian propane marketers had reasonable expectations that inventory would increase to a peak of 14.0-15.0 million bbl. Seasonal build rates were below average, however. NEB reported Canadian inventory in underground storage reached a peak of 13.6 million bbl. At this level, inventory was 1.6 million bbl more than in 2011 and the 3-year average.
Fig. 4 illustrates trends in propane inventory in US storage.
Regional inventory trends
Table 2 presents trends in regional propane inventory. EIA statistics showed 16.3 million bbl of propane inventory remained in primary storage in US Petroleum Administration for Defense District (PADD) 2 on Mar. 1, 2012. (See accompanying box for PADD regions.)
Inventory on Mar. 1 was 6.8 million bbl more than year-earlier volumes and 5.6 million bbl more than the 3-year average. Inventory carried over from winter 2011 was 42% of the average seasonal build for 2009-11.
Inventory build during second-quarter 2012 was 7.5 million bbl (about 50% of typical seasonal accumulation). Based on EIA monthly statistics for July and weekly data for August and September, we estimate inventory increased by an additional 4.0-4.5 million bbl and inventory in PADD 2 reached a peak of 28.5-29.0 million bbl on Oct. 1.
At this level, inventory in PADD 2 storage was 3.5-4.0 million bbl more than in 2011 but only 1.5-2.0 million bbl more than the 3-year average. Inventory in PADD 2 storage on Oct. 1 was manageable, so long as demand equals historic averages during winter 2012.
EIA statistics showed inventory in primary storage in PADD 3 (excluding nonfuel propylene) reached its seasonal minimum of 17.1 million bbl on Feb. 1 (2 months sooner than usual). Inventory on Feb. 1 was 3.3 million bbl more than in 2011 but was 0.5 million bbl lower than the 3-year average.
EIA's monthly statistics showed inventory accumulation in PADD 3 storage was 6.6 million bbl in second-quarter 2012. The 3-year average for second quarter was 9.1 million bbl. We estimate inventory increased 4.5-5.0 million bbl in third-quarter 2012 vs. the 3-year average of 3.6 million bbl.
On Aug. 1, 2012, inventory in PADD 3 storage was 29.2 million bbl, according to EIA statistics. At this level, inventory was already more than peak volumes in 2010 and 2011 but was almost 3 million bbl lower than on Aug. 1, 2009. In 2009, inventory in PADD 3 increased to a seasonal peak of 34 million bbl on Oct. 1. For 2012, we estimate inventory reached a seasonal peak of 30-32 million bbl on Oct. 1. These comparisons indicate inventory in PADD 3 storage on Oct. 1 was also at manageable levels.
Pricing, economics
Spot prices for dated Brent averaged $108-109/bbl during second and third quarters 2012. During second-quarter 2012, prices fell to about $95/bbl in June 2012 from about $120/bbl in April 2012. Spot prices for dated Brent, however, recovered during third-quarter 2012 and were $112-113/bbl in August and September.
EIA statistics show Saudi Arabia held production in second-quarter 2012 constant at 9.84 million b/d and most likely kept output constant in third-quarter 2012. Saudi Arabia's Minister of Energy, in a public statement in September, noted that he believed prices were too high, considering the fragile state of global economic growth. Prices dipped the next day but recovered on the following day.
US and EU member countries followed through with stated intentions to impose additional economic sanctions and an embargo on crude oil purchases from Iran. EIA statistics show Iran's crude oil production fell to 3.35 million b/d in June vs. 3.85 million b/d in January.
The EU embargo contributed to the decline in Iranian production and exports. The global supply-demand balance remained tight enough to limit any significant decline in prices despite indications of weakness in global economic growth. Most likely, Iranian production and exports will continue to decline during fourth-quarter 2012. Iranian production and exports are unlikely to recover in first-quarter 2013. This factor is a bullish consideration for crude oil prices.
Propane prices averaged about 120¢/gal in April but dropped to 95¢/gal in May and 79¢/gal in June. Price ratios vs. dated Brent were 37-38% in second-quarter 2012 vs. 45% in first-quarter 2012. Ethylene production costs based on spot prices in Mont Belvieu were 12¢/lb in second-quarter 2012 and were only 0.5¢/lb more than production costs based on ethane. Propane provided ethylene producers with economic incentives of 20-28¢/lb vs. natural gasoline in second-quarter 2012.
In third-quarter 2012, prices recovered to 88-90¢/gal, but ratios vs. dated Brent were even lower than in second quarter and averaged 34-35%. Ethylene production costs based on propane, however, were 14-15¢/lb and were 3-4¢/lb more than costs based on purity ethane. From the perspective of ethylene feedstock buyers, this shift shows propane prices were moderately stronger in third-quarter 2012 than in second-quarter 2012 and indicate the "sellers panic" did not get worse even though bearish influences were almost unrelenting.
Propane prices, winter 2012
Trends in European stock markets and the rebound in Euro values compared with the US dollar, however, indicate that some people believe there are reasons to be cautiously optimistic for European economies in 2013.
The continued decline in Iranian production and exports will offset supply growth in other areas and supply will remain tight as long as major global economies do not slide into recession.
We forecast dated Brent prices will average $105-115/bbl during fourth-quarter 2012 and first-quarter 2013, but we acknowledge the growing risk of recession in Europe and North America and the bearish implications for crude oil prices.
Supply-demand considerations for propane will remain distinctly bearish during winter 2012. Specifically, inventory in PADD 3 will remain above average through Apr. 1, 2013, even with exports at maximum rates, little or no seasonal decline in feedstock demand, and a typical seasonal increase in retail demand.
Despite these bearish fundamentals, the increase in retail demand (assuming winter weather reverts to the 5-year average) will reduce the intensity of bearish considerations during December through February by encouraging NGL traders to reduce short positions.
In the Gulf Coast ethylene feedstock markets, ethane prices will remain weak and trends in propane's feedstock-parity values vs. purity ethane will continue to limit the upside for spot prices in Mont Belvieu. We forecast spot prices in Mont Belvieu will average 90-95¢/gal in fourth-quarter 2012 and 95-105¢/gal in first-quarter 2013.
The author
Daniel L. Lippe ([email protected]) is president of Petral Consulting Co., which he founded in 1988. He has expertise in economic analysis of crude oil, refined products, natural gas, NGLs, other ethylene feedstocks, and primary petrochemicals. Lippe began his professional career in 1974 with Diamond Shamrock Chemical Co., moved into professional consulting in 1979, and has served petroleum, midstream, and petrochemical industry clients. Lippe holds a BS (1974) in chemical engineering from Texas A&M University and an MBA (1981) from Houston Baptist University. He is an active member of the Gas Processors Suppliers Association and serves on GPA's NGL Market Information Committee.
