US SHALE OIL-GAS PRODUCTION POTENTIAL—3 (Conclusion): US shale oil output likely to offset decline from conventional fields
Richard S. Bishop
Rick A. Baggot
Wayne L. Kelley
Robert E. Fargo
RSK (UK) Ltd.
Houston
This is the third of three parts on the potential of domestic unconventional shale oil and gas production to displace oil imports to the US.
Assumption: satisfactory oil price
Through much of the age of oil, production capacity has exceeded demand. Consequently, demand determined production rate.
Domestic nonconventional oil production rates are more a function of global oil price than resource size. In contrast to gas development which requires market growth and long term supply, the US market will consume all domestic oil that is produced. US oil is high cost oil,1 2 and if US production increased to a rate in excess of global demand growth, market forces would decrease price. However, this is a more complex problem than simple supply and demand making excess supply an unlikely event.
Forecasting global supply rate is difficult, but given the low rate of finding supergiant fields, a large, rapid addition to supply is unlikely in spite of the large in-place volumes associated with shale oil. Today, with most nations importing oil, domestic supply from shale oil becomes a more important part of domestic supply and the question is "how much." Therefore, an addition of a few million barrels a day of production from shale oil over the next decade is not likely to suppress oil prices but will serve to offset decline from conventional fields.
The model
The computational model is the same as described in Part 1 of this series with the well declines based on published well results (OGJ, Aug. 6, 2012, p. 40). We recognize that these decline curves are uncertain, but our goal is to capture the range, not to characterize an average for the entire US.
Resource base
Current estimates of the US shale oil resource are wide ranging and constantly changing as information becomes available from the large number of new wells.
For example, the 2008 USGS assessment of the Bakken3 was 3 to 4.3 billion bbl with a mean of 3.65 billion. Today, Industry comments indicate 10 to 20 billion bbl recoverable.4 Similar ranges also exist for the Eagle Ford and Haynesville.
The authors' models presume resource sizes of 10 billion, 20 billion, and 30 billion bbl. These sizes are not attempts to estimate the resource but are reference "units" that can be adjusted as resource estimates change. In addition to resource volume, we limited drilling by area of the play which was defined as approximately 1 million bbl/sq mile.
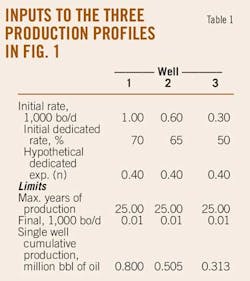
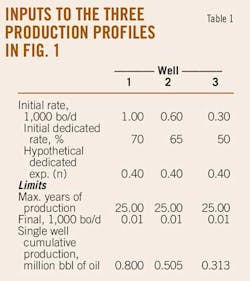
Well production profiles
Defining "typical" production profiles for shale oil is difficult due to the rapidly changing nature of completion technology. Indeed, Pauls and Christie5 question whether it is too early for decline analysis because even older wells have been recompleted and are still in transient flow.
Nonetheless, we have attempted to capture a range of profiles that are reported and are currently commercial. The range is from outstanding to marginal wells. Table 1 lists the input data.
Drilling effort and production plateau
Currently in the US, more than 225 rigs are active in the Bakken alone, and the drilling rates in the models are based on a combination of current activity and illustration.
Most importantly, a fixed rig fleet size depends on estimated ultimate recovery of a play in order to produce a sustained production plateau. Large fleets developing small EURs create production dropoffs that are unrealistic. In contrast, small fleets developing large EURs create production plateaus that are unrealistically long.
A minimum length of plateau has been based on the expected life of a rig of about 7 years. Other factors, such as drilling the least productive areas last and improvements of technology, may also lengthen the duration of productivity for a given resource.
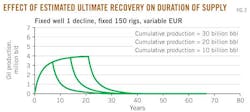
Dependence of EUR, drilling, and production plateau
Figs. 2 and 3 illustrate how EUR and drilling rate affect production profiles for a fixed well decline (Well 1, Fig. 1).

Relation of EUR, well rate, and drilling rate
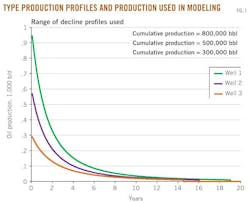
Given the original well production profiles in Fig. 1, how might the resource produce?
Fig. 4 A-C is a comparison of the production profiles for a drilling program of 250 wells/month but with different well rates as shown in Fig. 1.

The graphs show a fixed drilling program produces shorter production plateaus for more productive wells than less productive wells. The opposite is also true, that more active drilling programs produce shorter plateaus for a given well decline type.
Some of these scenarios in Fig. 2 are more realistic than others because they have plateaus of production.
Economic considerations
Costs
The following graphs, which are based on some recent production from Bakken wells, illustrate the great difficulty in replacing imported oil with shale oil in the US.
The major limitation is the current resource base. Even with the large additions of a few tens of billions of barrels being suggested for the Eagle Ford, Haynesville, and others, adding 9 million b/d for a sustained period of time is not likely due to amortization considerations for infrastructure.
Nonetheless, the graphs do provide a means for estimating possible shale oil production from multiple formations for several years. This presumes a consistently sufficient oil price.
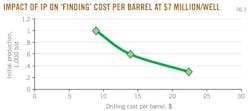
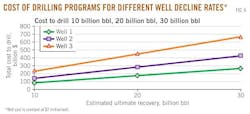
Figs. 5 and 6 show drilling costs for the different scenarios. Note the cost to drill for 1 bbl of US shale oil can range from roughly $5 to $25/bbl compared with importing 1 bbl at $50-100/bbl.
Recall that one assumption was 100% success rate, thus this cost is most equivalent to a finding cost rather than a development cost. Finding cost today for conventional oil is generally less than $2/bbl. The overall cost increases due to the increased number of wells to develop the same resource size.
Fig. 5 illustrates the impact of initial potential on development cost.
Implications to US production
The US is in the process of delineating the size of its shale oil resources. This process will require years, but the in-place volumes are likely to be in the hundreds of billions of barrels. However, several factors prevent shale oil production from coming on line quickly:
• The discovery process is slow, unlike finding giant conventional fields.
• The development process (i.e., drilling the production wells) is incremental, requiring many wells and continuous drilling, in contrast to conventional development.
• The infrastructure to be developed will be areally dispersed, unlike conventional fields.
• The large areas of the fields encompass a broad diversity of development impediments including logistical, financial, environmental, and landowner concerns.
As mentioned earlier, we are not trying to forecast but to set some boundaries to production possibilities. Fig. 4 A-C helps to define ranges. Note that most relationships are not linear. For example, doubling the rig count will decrease plateau time by more than half and doubling the EUR can increase the plateau duration by threefold.
Recognizing there are many caveats, what can be said about contributions from shale oil to US production?
First, it is unlikely for shale oil to replace US imports of 9 million b/d on a sustainable basis of, say 10 years, because it requires both a greater EUR than that currently known combined with a significant improvement in well productivity. The increase of EUR is required for increasing the plateau duration.
Secondly, using current estimates, shale oil is likely to provide long-term US production of "a few" million barrels per day. This production, however, requires high oil prices and is vulnerable to global price declines.
Shale oil competes with lower cost conventional oil making shale oil projects more vulnerable to declining prices. The low-cost supplier always wins when supply is abundant and prices are low. Technology plays a role in determining costs, but not so much as ease of extracting the oil from the earth.
Reduction of oil imports
The limit for oil production rate over the next 50 years is the total resource volume, unlike gas which is not limited over the same period by resource but rather by demand driving the rate of development.
A shale gas resource of 1,000 tcf is the equivalent of about 160 billion bbl of oil (a reasonable estimate of domestic gas), whereas the shale oil resource is estimated as between 10 billion and 40 billion bbl.
In other words, the shale oil resource volume as currently estimated is not sufficient to replace imported oil even though shale oil can reduce imports by perhaps 10-20%. Also the US oil production decline of 5%/year is about 250,000 b/d. Clearly, the shale oil resource can offset such a decline for several decades.
What about the Bakken?
Obviously there is a great deal of interest in the Bakken today, and the well profiles used here are based on that experience.
There is also a high expectation that Industry will develop the technology to exceed the USGS EUR estimate of about 3 billion bbl. The following are speculations on how the play production profile might evolve. Note this production should be added to the current production.
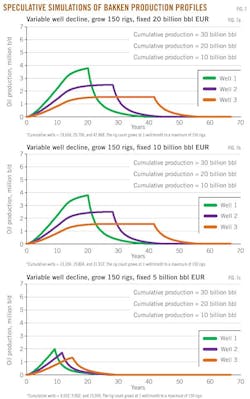
Comparing Figs. 7 A-C shows how the EUR and drilling effort interact to determine production rate and production duration. With a high rig count and lower EUR, the resource can be developed before a plateau is reached (e.g., Well 1, B and C), whereas a higher EUR allows the production plateau to be maintained for several years (e.g., Well 1, A).
References
1. Kelley, W.L., and Bishop, R.S., "Economic limits to oil supply: A non-Hubbert curve view," Houston Geological Society Bull., Vol. 53, No. 8, 2011, pp. 32-43.
2. Kelley, W.L., and Bishop, R.S., "Global oil trade: The relationship between wealth transfer and giant fields," XXI World Energy Congress, Montreal, 2010.
3. Pollastro, R.M., Cook, T.A., Roberts, L.N.R., Schenk, C.J., Lewan, M.D., Anna, L.O., Gaswirth, S.B., Lillis, P.G., Klett, T.R., and Charpentier, R.R., "Assessment of undiscovered oil resources in the Devonian-Mississippian Bakken formation, Williston Basin Province, Montana and North Dakota," US Geological Survey Fact Sheet 2008-3021, 2008, 2 pp.
4. Stark, Pete, IHS Inc., personal communication, 2011.
5. Pauls, J., and Christie, K., "Bakken—Too early for Decline Analysis?," 2010 (http://www.ajmpc.com/ajmblog/122/158/Bakken—Too-Early-for-Decline-Analysis.html).
Bibliography
Ahmed, Usman, and Hannan, Selim, "International shale reservoirs: tiering them into four levels," AAPG Search and Discovery 30140, 2010.
Bishop, R.S., Baggot, R.A., Kelley, W.L., and Fargo, R.E., "What is the current potential shale oil and gas production in the US?," Houston Geological Society Bull., Vol. 54, No. 3, 2011.
Curtis, John B., "Fractured shale-gas systems," AAPG Bull., Vol. 86, No. 11, 2002, pp. 1,921-38.
Energy Information Administration, Electric Power Monthly, March 2011, Table ES1.B, p. 5.
EIA, Annual Energy Outlook, Early Release Overview, 2011.
EIA, "World Shale Gas Resources: an initial assessment of 14 regions outside the US," US Department of Energy, 2011 (www.eia.gov).
Jarvie, D.M., Hill, R.J., Ruble, T.E., and Pollastro, R.M., "Unconventional shale-gas systems: the Mississippian Barnett shale of north-central Texas as one model for thermogenic shale-gas assessment," AAPG Bull., Vol. 91, No. 4, 2007, pp. 475-99.
Jarvie, D.M., "Worldwide shale resource plays and potential," AAPG Search and Discovery 80144, 2011.
Horn, Myron K., 2011 (http://www.datapages.com/Partners/AAPGGISPublicationsCommittee/GISOpenFiles.aspx).
Kelley, W.L., Harrell, D.R., Bishop, R.S., and Wells, K., "Proposition: global effort to model largest oil fields," OGJ, June 8, 2009, pp. 20-25.
Potential Gas Committee, "Potential Supply of Natural Gas in the United States," 2010 ([email protected]).