Louisiana drilling and production activity review
Mark J. Kaiser
Yunke Yu
Louisiana State University
Baton Rouge
This article highlights results from an OGJ Executive Report on oil and gas activity in Louisiana.
There are surprisingly few assessments of Louisiana's drilling and production trends and correlations with activity drivers. We provide an overview of the most meaningful relationships to inform regulators, legislators, industry participants, and the general public wanting to learn more about Louisiana's oil and gas industry.
Leading US producing states
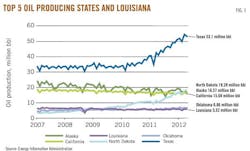
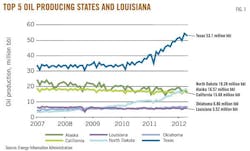
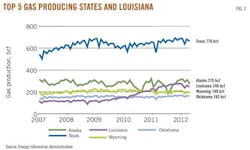
In June 2012, Louisiana ranked sixth in oil production and third in gas production in the US (Figs. 1 and 2).
Texas was the leading oil producing state in 2011 with 533 million bbl, followed by Alaska with 209 million bbl, California 196 million bbl, North Dakota 153 million bbl, Oklahoma 74 million bbl, and Louisiana 68 million bbl. Texas also led the nation with 7.9 tcf of gas production, followed by Alaska 3.2 tcf, Louisiana 2.9 tcf, Wyoming 2.4 tcf, and Oklahoma 1.9 tcf.
Administrative units
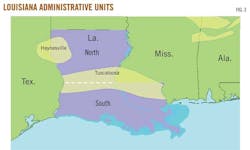
Louisiana is partitioned into two onshore regions to account for geologic differences and the natural variation in the terrain (Fig. 3).
In North Louisiana a variety of structural and stratigraphic traps exist, while in South Louisiana fault trends and salt domes dominate and the region is closely associated with the formation of the Gulf of Mexico basin.
North and South Louisiana differ with regard to the age and lithologies of the geologic formations, the type and quality of hydrocarbon fluids produced, the depth of the producing reservoirs, and structural features.
Production trends
South Louisiana is the primary oil producing region in the state, while North Louisiana is dominated by gas production and smaller amounts of crude oil and condensate.
In 2011, the South produced 50.3 million bbl of oil and 395 bcf of gas, the North produced 11.7 million bbl of oil and 2,439 bcf of gas, and offshore contributed 6.1 million bbl of oil and 68 bcf of gas. Most of the gas produced in the South and offshore is associated with oil production, while in the North, the majority of gas produced is from the Haynesville shale.
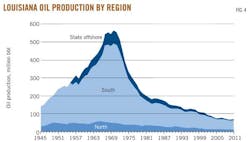
Crude oil production in Louisiana rose rapidly in the 1960s and has been in steady decline since peaking in 1970 (Fig. 4). Today, oil production is 24% of its 1965 peak in North Louisiana, 12% of its 1970 peak in South Louisiana, and 9% of its 1970 peak in state waters.
Louisiana's crude oil production is not being replenished, and as fields decline and cease producing, new discoveries have not kept pace. For the last few years, oil production has been relatively flat, supported by high oil prices and significant numbers of marginal producers.
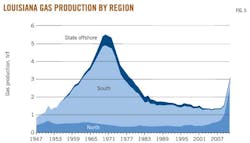
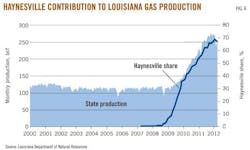
Gas production peaked alongside oil but its decline has dramatically reversed in recent years due to production in the Haynesville shale (Fig. 5). During the last 3 years, gas production in the state has doubled, and in 2011, 62% of state gas production was sourced from the Haynesville (Fig. 6). Production levels have recently declined due to weak gas prices and a significant retrenchment in the number of rigs working the Haynesville. Gas production in 2012 will fall from the 2011 level.
Producing wells
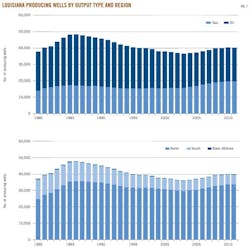
There were 40,149 producing wells in Louisiana in 2011 (Fig. 7).
A well is counted as producing if any amount of oil or gas was produced during the year. Wells that are shut in or temporarily abandoned for more than 1 year reduce the count. New wells that start production or idle wells that restart production increase the count.
In the mid-1980s, oil wells outnumbered gas wells two to one, while today, the numbers of producing oil and gas wells are nearly identical. North Louisiana has the majority of active wells in the state. In 2011, there were 33,863 producing wells in the North, 5,916 in the South, and 370 offshore.
Drilling activity
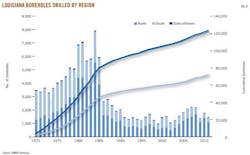
The numbers of boreholes drilled in the state since 1970 are shown by spud date and include all wells drilled into the ground (Fig. 8). If the well was drilled in search of hydrocarbons and is successful, it will be completed and the well classified as oil or gas depending on its primary product stream. Wells that are not completed are classified as dry holes and most of these "dusters" are plugged and abandoned shortly after evaluation. Service and injection wells refer to nonproducing wells required for field development (e.g., water wells, saltwater disposal).
In the late 1970s through 1985, more than 5,000 wells/year were spudded, reaching a peak in 1984 of 8,000 boreholes. From 1970 to 2011, a total of 123,459 boreholes were drilled in Louisiana (71,668 in the North, 49,664 in the South, and 2,127 offshore).
Over the past decade, drilling activity has ranged between 1,000 and 2,200 wells/year. Most wells drilled during this time were in the North, and the majority of wells spud in 2009-11 were Haynesville shale gas wells. In 2011, 1,447 boreholes were drilled in the state (1,064 in the North, 373 in the South, and 10 offshore).
Completed wells
The commercial viability of a deposit depends on its size, production rate, product quality and prices, cost, and related factors at the time of development. Deposits may not be profitable if they are too small or located in sensitive marsh habitats or come on line in a low price environment. Unconventional deposits require advanced (expensive) technologies to drill and complete, and greater uncertainty exists in predicting production rates and recovery volumes.
After a borehole is drilled, it will be completed if the cost of completion is less than the expected revenue of production. Completion in a conventional well involves placing production casing across the producing interval, inserting production tubing, perforating, and installing a wellhead. In shale plays, wells are drilled horizontally and hydraulically fractured. Stimulation occurs after liner is cemented in place across the lateral.
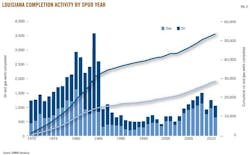
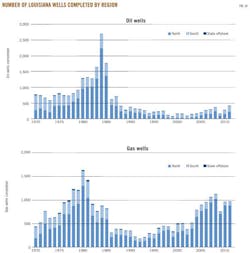
The numbers of wells completed are shown in Figs. 9 and 10 by product type and region. Since 1985 the numbers of completions have ranged between 500 and 1,500 wells/year. In most years, gas well completions dominated, but prior to 1990 oil well completions were in the majority for several years. From 1970 to 2011, 24,893 oil wells and 28,511 gas wells were completed in the state.
Completion rate
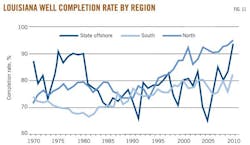
Completion rate is calculated from the number of wells drilled and completed during the year divided by the number of wells drilled.
Since the year of completion may not equal the spud year, we track wellbores through their completion date.
Service and injection wells are included in the count of wells drilled because they are completed similar to producing wells; however, almost all service and injection wells that are drilled are completed because they are constructed in the development of known reservoirs and are not drilled in the search of hydrocarbons. Completion rate therefore does not represent drilling "success" because service and injection wells are not associated with discovery risk.
Completion rates by region are shown in Fig. 11. Completion rates are highest in North Louisiana due to the characteristics of the formations, while offshore completion rates are the most volatile due in large part to the small number of wells drilled and the sensitivity of averages to sample size.
Completion rates reflect the geologic complexity of the region and have varied between 70%/year and 90%/year. Louisiana is a mature petroleum province and completion rates are relatively high, averaging 78% statewide over the past 4 decades. From 1970 to 2010, completion rates averaged 81% in the North, 79% offshore, and 74% in the South.
Abandonment activity
Wells are permanently abandoned at the end of their useful lives.
Permanent abandonment occurs for a producing well when it is no longer economic, for a service well when it is no longer needed to support operations or when the lease or unit on which it resides is no longer producing, and for a dry hole usually soon after evaluation.
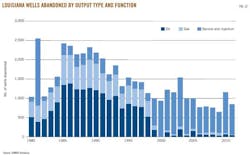
In Fig. 12, the number of wells abandoned per year, excluding dry holes, is depicted for oil, gas, and service wells by region. Over the past decade, between 600 and 1,500 wells/year were permanently abandoned.
Most abandonments were service and injection wells, with relatively small numbers of oil and gas wells abandoned. From 1980 to 2010, a total of 45,566 wells were permanently abandoned (18,687 oil, 10,644 gas, and 16,235 service wells; 18,709 in the North, 25,827 in the South, 1,030 offshore).
Drilling activity and price
The number of wells drilled per year is expected to vary with changing oil and gas prices.
As prices increase, producers invest more money to supply more commodity, and the amount of drilling activity is expected to increase. High rates of return attract investment dollars, but when investment in a region does not lead to the required rates of return, capital will be reduced or reallocated.
Capital budgets, strategic opportunities, management preferences, expected returns, prices, regulations, and incentives all impact an operator's decision to drill in ways that are difficult to measure and quantify.
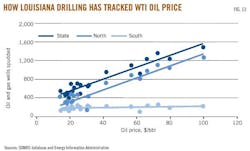
In Fig. 13, the number of oil and gas wells spudded per year is correlated against the annual average West Texas Intermediate oil price between 1990 and 2010. Price models only capture a one-dimensional slice of reality, but it is an important slice, because price is widely recognized as a driving factor in decision making and is closely tied to a company's financial performance vis-a-vis net income and operating budgets. The number of oil and gas wells drilled in Louisiana in the past 2 decades is closely correlated with changing oil prices, and an important regional difference is distinguished. The North is highly responsive to changing oil prices over the time period, whereas drilling activity in the South is almost completely inelastic to price.
On average, 174 wells/year were drilled in the South over the past 20 years regardless of oil price, while in the North, as oil prices increased the number of producing wells drilled increased, and for every $10/bbl increase in crude oil, an additional 130 producing wells/year come on line. Since drilling activity in the North dominates the number of wells drilled in the state, and the South has remained relatively constant over time, the statewide regression parallel trends in the North.
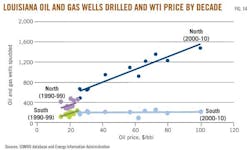
The numbers of oil and gas wells spud per year vs. annual average WTI oil price are broken out by decade in Fig. 14.
From 1990 to 1999, drilling activity in the North and South responded similarly to changing oil prices, while from 2000 to 2010, activity in the North exhibited a much stronger correspondence, and activity in the South was essentially flat. Drilling activity relations depend upon region and the time period of evaluation.
Abandonment activity and price
Well abandonments are expected to be negatively correlated with commodity prices because high prices encourage marginal production and delay the economic limit, while low prices force operators to close wells which are no longer profitable.
At low prices, high levels of well abandonments are expected, and conversely, high prices should be associated with low levels of abandonment.
For oil wells, $25/bbl crude induces annual abandonment levels of 800-1,200 wells, while for prices greater than $50/bbl, abandonments decline to around 100 wells/year (Fig. 15). For gas wells, $2/Mcf gas results in 400-700 abandonments/year, while for prices greater than $3/Mcf, abandonment activities drop below 100 wells/year.
Historically, $25/bbl oil induces between 1,000 and 2,200 total abandonments/year, while for $50/bbl crude and higher, the number of abandonments generally ranges from 500 to 1,000 wells/year.
The authors
Mark J. Kaiser ([email protected]) is professor and director, research and development, at the Center for Energy Studies at Louisiana State University. His primary research interests are related to policy issues, modeling, and econometric studies in the energy industry. Kaiser holds a PhD in industrial engineering and operations research from Purdue University.
Yunke Yu is a research associate at the Center for Energy Studies at LSU. His research interests are related to modeling and economic evaluation. He earned a bachelor of engineering in oil and gas transportation and storage from China University of Petroleum and a master of finance from Tulane University.
