Study improves estimation of damage from stuck pigs, hydrates
Alessandro Terenzi
Saipem
Fano, Italy
Two new field-verified calculation methods can provide efficient simulation tools for both pipeline design and operation analysis in assessing likely damage from dislodging a stuck pig or hydrate plug.
A stuck pig or formation of a hydrate plug can generate fast transient movements of large solid objects in natural gas pipelines, as can inadequate control of pig velocity during receiving operations. Creating a pressure jump across a stuck pig can dislodge it but can also create a sudden displacement, propelling the pig at high velocities and potentially damaging pipe bends or elbows.
A similar phenomenon occurs when a pipeline is depressurized following detection of a hydrate plug, with the purpose of moving thermodynamic conditions outside the hydrate formation region and allowing the hydrate to melt. One-sided depressurizations are riskier in this circumstance because a rapid pressure jump can occur, potentially launching the plug at high velocity.
But even two-sided depressurizations of a hydrate formation are not free of risk because high-pressure gas bubbles trapped inside the plug may have the same effect.1 Several pipeline failures have occurred due to strong impacts from hydrate plugs.2 3
Pig velocity during cleaning or inspection should be limited to 2 m/sec. Suitable outlet pressure and flow control can easily maintain this speed in the body of the pipeline. Gas velocity increase toward the pipeline's end, however, caused by gas expansion, makes pig control more difficult when approaching receiving facilities, requiring use of techniques such as valve throttling in the trap piping.
Evaluation of potential high-velocity pig impacts against pig-receiving trap doors needs to occur in the engineering stage of a natural gas pipeline to guard against potential errors in operation. The trap must be adequately designed, in terms of material properties and supporting, to sustain the possible impact forces.
Developed analytical methods take into account interaction of the pig (or plug) with both the pipe wall and the gas by considering compressibility-induced effects.
Modeling
The model derived from the new methods includes calculation of all forces acting during the pig or plug dislodgement, both for and against the eventual motion. Peak velocity is achieved very rapidly, allowing consideration of just the first instants of movement and not the motion's dynamic evolution.
Motion begins when the pressure differential across the pig or plugs overcomes the static resistance force causing the temporary blockage. This pressure differential, which could be very high, is the only term in the momentum balance equation moving in the same direction as the pig run.
Factors working counter to pig motion include:
• Fluid and pig (or plug) inertia.
• Pig and fluid friction against the pipe wall.
• Gas expansion upstream of the pig.
• Gas compression in front of the pig.
A model based on a rigid piston suddenly moving in a pipe containing a gas can evaluate the inertia of the pig (or plug) adjoining gas that is displaced as a consequence of dislodgement.4 Involved gas regions are the upstream section crossed by the rarefaction wave and the downstream section where the compression shock wave passed. The instantaneous velocities of the gas in the compressed region equals piston velocity, while in the upstream expanded region it equals piston velocity in part of it and then decreases to 0 in the rear of the rarefaction wave.4
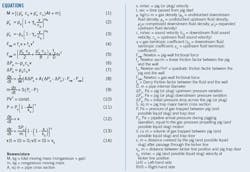
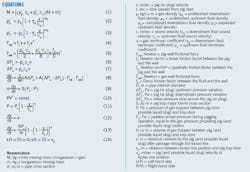
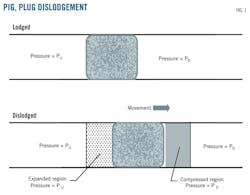
Fig. 1 shows gas expansion and compression regions. Equation 1 (see accompanying equation box) provides the total mass representing inertia of the fast-moving gas and solid. The mass of the downstream compressed region and upstream expanded region is determined by the relevant gas densities (Equations 2 and 3) through the adiabatic transformations calculated with reference to the undisturbed downstream and upstream conditions and the distance covered by each wave (rarefaction wave upstream and compression wave downstream).
Linearization of exact formulations yields the pressures in the compressed and expanded regions.4 Linearization is assumed to be possible because generated velocities are usually much lower than the gas sound velocity.
Both linear and quadratic velocity terms represent friction between the pig and pipe wall (Equation 4).5 Darcy's formula describes friction between gas and pipe wall, in the pig adjacent compressed and expanded regions (Equation 5)6 7 where an average velocity has been assumed for the rarefaction wave-crossed region.
Gas expansion upstream of the pig (or plug) decreases the available pressure differential by the term shown in Equation 6, obtained again through linearization of pressure in the upstream gas expanding isentropically.4 Derivation of downstream gas compression uses linearization of the rigid piston model (Equation 7).4
Equation 8 is the final momentum balance equation obtained by collecting all the above contributions, allowing calculation of the stoppage's dynamic evolution, and predicting peak velocity during fast start-up. This nonlinear first-order ordinary differential equation, in which the unknown velocity is expressed as a time function, is numerically integrated by a simple Euler's explicit time integration, with a very fine time step to achieve acceptable accuracy.8 Initial condition for velocity is zero.
Determining impact velocity and inputting it into structural software modeling pipe wall material behaviour can yield the relevant generated stress.
Pig impact
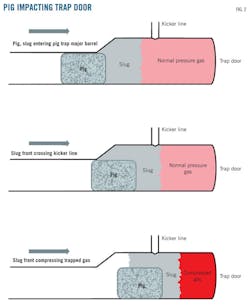
The presence and behavior of the gas inside the trap affect pig impact against the receiving trap door. When the pig is still before the kicker line, the gas in front of the pig flows through the exit line at the same rate as gas flowing upstream of the pig. Once the pig passes the kicker line, however, the gas in front of it is trapped and compressed toward the trap door. The trapped gas will cause the pig to decelerate, eventually bringing it to a halt when resistance forces (pressure differential and friction) across the pig equal pig inertia.
Pigs can also experience a final backward movement when the trapped gas pressure is released, equalizing pig upstream pressure.
A liquid slug accumulated in front of the pig can complicate this process. The liquid slug does not keep a single-phase liquid distribution when it enters the trap due to mixing with the internal gas. When the pig passes through the kicker line, it pushes liquid toward the trap door, causing a trapped gas pressure increase and penetration of gas bubbles into the liquid, helping damp any pressure surges and decelerating the slug.
A model considers the pig as a rigid body, occupying the whole trap major barrel cross-section, and limits its arrest motion inside the trap as determined by the balance over time between pressure differential and pig inertia alone, excluding possible gas backflow across the free cross-section between the pig and the trap's major barrel.
This model can be conservatively applied to the presence of a liquid slug as well, assuming it to be part of the rigid body. In this instance, trapped gas compression begins when the slug front arrives at the kicker line location.
The following further simplifying assumptions were also part of developing the model:
• Pressure drop across the pig (and the liquid slug, if any) is neglected.
• Gas thermodynamic transformations are modeled through a perfect gas approach but use real gas isentropic coefficients calculated at operating pressure and temperature conditions.
• When a liquid slug is present in front of the pig, it is assumed to keep sharp boundaries and not have gas entrainment after its passage through the kicker line.
Fig. 2 shows a scheme of the modeled system.
Equation 9 shows the momentum balance equation, in which the left-hand side represents the pig (and possible slug) inertia while the right-hand side shows the net force acting on the pig as a consequence of the pressure differential between trapped gas (between the kicker line and trap door) and the pressure upstream of the pig. Equation 10 derives the pressure of the trapped gas evolution by applying the pressure-volume relationship valid for a perfect gas.
The evolving trapped gas volume, which progressively decreases as the pig moves forward, is a function of the distance covered by the pig (or by the slug front) once the kicker line is passed. The kicker line can therefore be assumed to lie at the origin of the longitudinal axis along which the pig run deceleration occurs.
Equation 11 provides the relevant correlation, establishing a system of coupled nonlinear ordinary differential equations, with the two unknowns distance and velocity, a function of time. Equations 12-14 represent the system, along with initial conditions. The initial condition for the velocity is the pig (or pig and slug) velocity in correspondence with the kicker line. A simple Euler's explicit time integration, with a very fine grid to get acceptable accuracy, solved the system.8
Project cases
Researchers compared the newly developed dynamic model for simulating pig or plug dislodging with available field measurements. The only published measurement value of peak velocity after sudden displacement referred to hydrate plug decomposition tests performed on a 4-in. OD gas-condensate pipeline in Wyoming9 with the following data:
• Hydrate plug mass = 50 kg.
• ID = 0.1 m.
• Pressure upstream of the pig before dislodgement = 2.72 MPag.
• Pressure downstream of the pig before dislodgement = 0.17 MPag.
• Fluid molar composition = Werner-Bolley fluid.10
• Plug-wall linear friction factor = 50 Newton sec/m.9
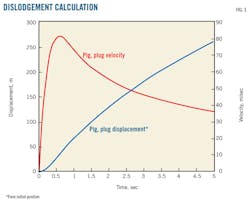
Fig. 3 shows the calculated hydrate plug velocity time trend after dislodging, using the current model. The calculated peak velocity is 81.1 m/sec, reached after 0.6 sec, in good agreement with the measured reported peak velocity of 82.3 m/sec.9
No further data are available in the open literature to test the new model with reference to pig motion. It was, however, applied to investigating an 18-in. OD lift gas pipeline incident, which occurred during pigging operations conducted as part of commissioning. The accumulation of a large amount of debris (2 tons) in front of a cleaning pig caused it to become stuck.
Operators tried to displace the pig by applying a large pressure differential; increasing upstream pressure until it was 2 MPa greater than downstream pressure. The pig suddenly dislodged and caused damage in a bend close to its stuck position. Simulation of the pig displacement motion allowed estimation of its transient evolution and peak velocity. Stress engineers applied software for calculation of dynamic loads on pipes to the data and found the resulting damage to be consistent with calculated pig dynamics.
Input data used for this calculation included:
• Pig and debris mass = 2,500 kg.
• ID = 0.4318 m.
• Pressure upstream of the pig before dislodgement = 6.1 MPag.
• Pressure downstream of the pig before dislodgement = 4.1 MPag.
• Fluid molar composition = lift gas, with 60% methane, 17% ethane.
• Pig-wall linear friction factor = 1000 Ns/m.
• Quadratic friction factor = 100 Newton sec2/m2.
Previous pigging simulation study experience and published data provided friction factors.11
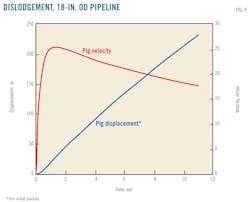
Fig. 4 shows the calculated pig and accumulated solid velocity time trend after dislodging, with the current model. The calculated peak velocity is about 25.5 m/sec, reached after 1.4 sec, consistent with the successive pipe structural analysis already reported.
The last calculation refers to the model for the calculation of the pig arrest load on the receiving pig trap door. No published data are available for model validation. Researchers applied the model to a new 10-in. OD high-pressure gas pipeline to be installed at a gas storage site. The major barrel of the receiving pig trap had a 16-in. diameter. Estimates placed the amount of free water in the line before pigging at 0.66 cu m. The highest possible operating pressure at pipeline arrival during pigging is 20 MPag, the worst case in terms of generated maximum pig arrest load.
Input data used for this calculation are:
• Pig and liquid slug mass = 675 kg.
• Trap major-barrel internal diameter = 0.3248 m.
• Distance between kicker line and trap door = 1.5 m.
• Arrival pressure during pigging = 20.0 MPag.
• Assumed pig and slug velocity at kicker line position = 3 m/sec.
• Fluid molar composition = natural gas, with 92% methane and 4% ethane.
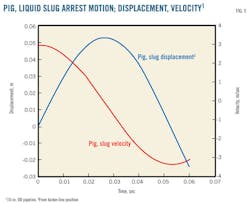
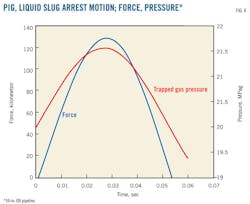
Fig. 5 shows calculated pig and slug velocity and displacement time trends after passage through the kicker line, while Fig. 6 shows calculated force and pressure trends in the trapped gas. The reported velocity and displacement trends include backward pig movement caused by gas elastic energy release. Calculated peak load is about 130 kilonewtons for this case, and is developed in a very short time, less than 0.1 sec.
References
1. Peters, D.J., Selim, M.S., and Sloan, E.D., "Hydrate Dissociation in Pipelines by Two-Sided Depressurization : Experiment and Model," Annals of the New York Academy of Science, Vol. 912, January 2000, pp. 304-13.
2. Sloan, E.D., "Hydrate Engineering," Monograph 21, Society of Petroleum Engineers, Richardson, Tex., 2000.
3. Canada National Energy Board Report No. NE23-119/2004E, "Pipeline Incident Report—Natural Gas Pipeline Rupture Near Fort St. John, British Columbia," May 15, 2002.
4. Landau, L.D., and Lifshitz, E.M., "Fluid Mechanics," Second Ed., Pergamon Press, Oxford, UK, 1987.
5. SPT Group, OLGA, Version 6.2, User Manual, 2010.
6. Keenan, J.H., and Neumann, E.P., "Measurements of friction in a pipe for subsonic and supersonic flow of air," Journal of Applied Mechanics, Vol. 13, No. 2 (February 1946), p. A91.
7. Terenzi, A., Carniani, E., Donati, E., and Ercolani, E., "Problems of Nonlinear Fluid Dynamics in Industrial Plants," Complex Flows in Industrial Processes, Birkhauser, Boston, 2000.
8. Press, W.H., Flannery, B.P., Teukolsky, S.A., and Vetterling, W.T., "Numerical Recipes in Fortran—The Art of Scientific Computing," Second Ed., Cambridge University Press, Cambridge, UK, 1992.
9. Xiao, J.J., Shoup, G., and Kruka, V., "Predicting Hydrate Plug Movement During Subsea Flowline Depressurization Operations," Offshore Technology Conference, Houston, May 4-7, 1998.
10. Sloan, D., Koh, C., Sum, A.K., Ballard, A.L., Creek, J., Eaton, M., Lachance, J., Mcmullen, N., Palermo, T., Shoup, G., and Talley, L., "Natural Gas Hydrates in Flow Assurance," Gulf Professional Publishing, Burlington, Mass., 2011.
11. Tang, Y., "Plunger Lift Dynamic Characteristics in Single Well and Network System for Tight Gas Well Deliquification, " SPE Annual Technical Conference, New Orleans, Oct. 4-7, 2009.
The author
More Oil & Gas Journal Current Issue Articles
More Oil & Gas Journal Archives Issue Articles
View Oil and Gas Articles on PennEnergy.com
