US demand for energy to keep falling—but not for natural gas
Marilyn Radler
Senior Editor-Economics
Laura Bell
Statistics Editor
Total US energy demand in 2012 will decline for the second consecutive year as economic sluggishness and high unemployment continue to reduce energy consumption and stimulate energy-use efficiency.
Shrinking oil and coal consumption will cause total US energy demand to contract by 1%. Natural gas demand will remain robust, though, in light of low prices and coal plant retirements. US production of natural gas is on track to post another annual increase.
Oil prices face downward pressure from elevated output in unconventional deposits in the US and from greater production by members of the Organization of Petroleum Exporting Countries (OPEC) as well as from further slowing of the worldwide economy.
US oil inventories will build this year, reversing last year's volumetric decline of crude and products in storage. Oil exports will increase, and imports will fall from 2011 levels.
Worldwide oil demand
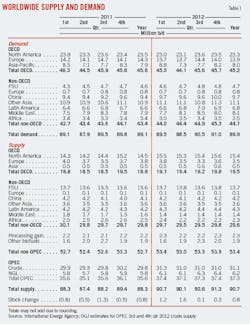
Global oil demand will climb to an average 89.9 million b/d this year from the 2011 average of 89.1 million b/d, according to the latest projections from the International Energy Agency (IEA).

With demand especially anemic in Europe, oil demand will contract by 400,000 b/d this year in the developed countries of the Organization for Economic Cooperation and Development (OECD) and grow by 1.22 million b/d in non-OECD countries, with the largest increases in China, Russia, Africa, and the Middle East.
Still, global economic weakness threatens oil demand growth. Chinese economic growth is slowing. Many economies in Europe are now in or close to recession, while in the Middle East and North Africa unrest has spread, further depressing the region's outlook even as some economies rebuild after earlier conflicts, the International Monetary Fund (IMF) said in its April world economic outlook.
IMF projects that the world's advanced economies will record real gross domestic product (GDP) growth in 2012 of a combined 1.4%. This includes a contraction of 0.3% in the euro area, where IMF projects a 0.5% contraction in the first half of 2012 and recovery thereafter, and 0.8% GDP growth in the UK for the year.
Asia has weathered the global slowdown well and looks headed for a soft landing, IMF said, while Latin America and sub-Saharan Africa have been resilient to the European slowdown.
Total non-OECD oil demand will average 45.19 million b/d this year, down from last year's 45.64 million b/d, according to IEA figures. In the US, demand will shrink to 18.73 million b/d from the 2011 average of 18.9 million b/d.
Global oil supply
Oil demand growth will be met by output increases from Canada, the US, and OPEC. IEA and OGJ forecast total oil supply this year will average 90.7 million b/d.
IEA estimated that North American oil output will average 15.4 million b/d, up from last year's 14.5 million b/d in spite of a 500,000 b/d decline in Mexico to 2.89 million b/d. Onshore crude and natural gas liquids (NGL) supplies will account for much of the increase in North America, as IEA forecasts US liquids production to rise to 8.79 million b/d from last year's 8.09 million b/d.
Total OECD supply will average 19.5 million b/d, up from last year's 18.8 million b/d, IEA forecasts, with supply down in Europe on shrinking North Sea production and stable output in the Pacific.
Non-OECD oil supply will decline to 29.6 million b/d this year from 29.8 million b/d last year as decreases in the Middle East and Africa outweigh small increases in the former Soviet Union, Latin America, and China.
Crude oil supply from OPEC, which has an official output target of 30 million b/d, will climb to average 31.1 million b/d from 29.8 million b/d a year ago, OGJ forecasts.
"What happens to oil prices over the next 6 months is largely in the hands of OPEC or, more accurately, of Saudi Arabia, which has effectively been given a free hand to produce as it sees fit in the absence of a meaningful output agreement," the Centre for Global Energy Studies said following OPEC's most recent ministerial meeting last month, during which the group left its production target unchanged. "How much oil the kingdom needs to produce in the second half of the year will depend on its own price ambitions and on the level of production from Iran."
Spare production capacity within OPEC in May was 3.01 million b/d, with 2.39 million b/d of this in Saudi Arabia, according to CGES estimates.
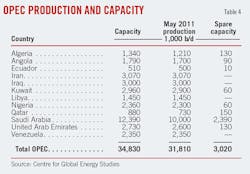
IEA reported that first-quarter 2012 OPEC crude output was 31.3 million b/d. The group's NGL output is set to average 6.2 million b/d this year.
Crude oil output from Libya averaged just 460,000 b/d last year, down from 1.55 million b/d a year earlier, according to IEA estimates. Despite the fallen average, production increased rapidly during the year. The agency's latest estimates indicate that Libyan crude oil output averaged 1.3 million b/d in this year's first quarter and has climbed further since.
Combined with IEA's outlook for demand, total 2012 oil supply of 90.7 million b/d would result in an average stockbuild of 800,000 b/d.
US economic growth
The US economy will continue to be anemic this year; OGJ forecasts 1.3% annual growth in GDP.
The US Bureau of Economic Analysis reported that first-quarter growth was 1.9%, and fourth-quarter 2011 economic growth was 3%.
US GDP growth slowed to 1.7% in 2011. This followed a rebound to 3% GDP growth in 2010 from a 2009 contraction of 3.5%. The Federal Reserve Board and Federal Open Market Committee last month released their latest projections, which forecast 2012 US GDP growth within a range of 1.6-2.5%, with a central tendency of 1.9-2.4%. The outlook also sees unemployment improving little over the next couple of years, with a forecast of 7.5-8% in 2013 and 7-7.7% in 2014.
The official unemployment rate recently was 8.2%. Job growth in the private sector since the official end of the recession has been weak, although the unemployment rate is down from its October 2009 peak of 10%.
Also, the Conference Board Consumer Confidence Index recorded declines in April and May, indicating that consumers were less positive about current business and labor market conditions and were more pessimistic about the short-term outlook.
There were positive moves among the economic indicators during this year's first half, including increases from a year earlier in building permits, housing starts, and sales of new and existing single-family houses. Still, the housing market remains fragile and could weaken further with another economic downturn.
Energy demand by source
US demand for the major sources of energy will be mixed this year, as oil demand and coal consumption contract, natural gas demand climbs, and nuclear and renewable energy sources see small gains in demand from a year ago.
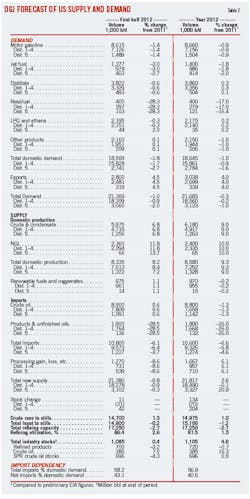
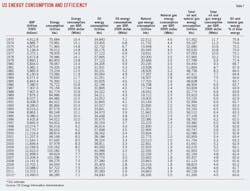
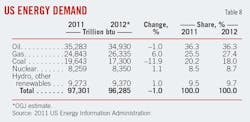
Total energy demand will be 96.285 quadrillion btu (quads), a decline from the 37.301 quads of energy demand in 2011 reported by the US Energy Information Administration (EIA). This decline coupled with the uptick in economic output will drive an efficiency gain to 7,138 btu/$ of GDP from 7,308 btu/$ of GDP a year ago.
US energy demand in 2010 rebounded to 97.722 quads following the recession-driven drop to 94.559 quads in 2009, which was a 5% drop from total demand recorded in 2008.
Increased fuel efficiency and reduced driving will be the primary drivers of this year's oil demand. OGJ forecasts a 1% decline in demand for oil from last year to 34.93 quads. As it did in 2011, oil will account for 36.3% of the US energy market.
Natural gas demand will increase by 6% this year, as low prices result in gas use displacing some coal use in power generation. Gas demand will total 26.335 quads this year and account for 27.4% of the US energy market, up from last year's 25.5% share.
With historically low natural gas prices and the warmest March ever recorded in much of the US, coal's share of total net electricity generation dropped to 34% that month, the lowest level since at least January 1973, EIA reported.
Despite seasonally low loads, natural gas-fired generation grew markedly and accounted for 30% of overall net generation by March, EIA added. Total electricity demand fell this past winter as warmer weather reduced home heating requirements.
OGJ forecasts that coal demand will shrink by about 12% to 17.3 quads this year and see its share of the US energy market fall to 18% from just over 20% a year ago. Mounting environmental regulations are resulting in the closure of older coal-fired plants, which would otherwise face expensive retrofits.
Nuclear demand will increase a bit after last year's decline in the wake of the Fukushima disaster in Japan. Total US nuclear demand will be 8.35 quads this year.
Demand for renewable energy sources will climb by 1% from a year ago as use of solar, wind, and biomass climbs. This year's use of hydroelectric power generation will fall from a particularly strong level of generation in 2011. Combined, renewable energy sources will account for 9.7% of this year's energy use.
Oil prices
Oil inventories at Cushing, Okla.—up about 25% now from a year ago—have put downward pressure on the price of West Texas Intermediate crude oil, and weak economic conditions threaten further deterioration in US oil prices this year.
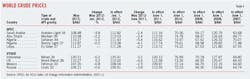
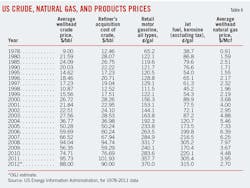
OGJ forecasts that the average US wellhead price of crude this year will be $88/bbl, down from $95.73/bbl last year.
With output increases from other OPEC members and release of oil from strategic storage by member-nations of the IEA, the market weathered the temporary loss of most Libyan crude oil during that country's revolution last year. Contracting North Sea production propped up the price of Brent crude oil until this spring, when the price of the benchmark's front-month futures price began its decline from a high of $126.22/bbl on Mar. 13.
Prices of front-month Brent futures have exceeded those of WTI continuously since August 2010. The differential between the two crudes reached nearly $28/bbl last autumn but has recently dipped to less than half as much.
Negative market sentiment in the second half of last month drove the front-month futures price of WTI below $80/bbl for the first time since October 2011. Similarly, Brent futures closed below $90/bbl for the first time since December 2010.
Retail motor gasoline prices in the US will decline in this year's second half following a strong start in the first 5 months. OGJ forecasts that gasoline pump prices will average $3.70/gal this year, up from a 2011 average of $3.577/gal.
In an unusual response to elevated prices of another important oil product, Delta Airlines' Monroe Energy LLC subsidiary purchased the 185,000-b/d Trainer, Pa., refinery near Philadelphia from Phillips 66 Co. for $180 million on Apr. 30 (OGJ Online, May 7, 2012). The airline plans to insure supply of jet fuel in the US Northeast with the purchase.
Delta said its purchase of the refinery will mitigate risk associated with the jet fuel crack spread and reduce risk for 80% of its US fuel consumption.
In the first quarter of 2012, the average US retail jet fuel price was $3.21/gal, 12% higher than a year earlier. For all of 2011, the retail price averaged $3.05/gal, up from the 2010 average of $2.20/gal.
Gasoline demand
Greater vehicle efficiency, reduced discretionary driving in light of strong pump prices, and high unemployment will lower gasoline demand in 2012 to an average 8.66 million b/d from last year's 8.736 million b/d.
The increased use of home offices and the internet have dented vehicle-miles traveled. And the trend of improving vehicle efficiency is likely to prevent gasoline demand from returning to its 2007 peak of 9.29 million b/d, even if unemployment begins to return to prerecession levels in the near term.
Distillate demand
Demand for distillate fuel oil will be little changed at 3.86 million b/d this year. This includes small volumes of renewable diesel fuel, including biodiesel, blended into distillate fuel oil.
A year ago heightened economic activity boosted distillate demand to 3.85 million b/d from its 2010 average of 3.8 million b/d. Increased distillate use by industrial and transportation consumers during the first half of 2011 as compared to the first half of 2010 resulted in the annual climb.
Jet fuel demand
Jet fuel demand will average 1.4 million b/d this year as airlines continue to build efficiencies into their systems.
In the second half of 2011, demand shrank from year-earlier levels, resulting in a small annual decline for jet fuel to 1.425 million b/d from 1.432 million b/d in 2010. Annual demand averaged just 1.39 million b/d during 2009, when the US recession led to a 9.5% decline in demand for jet fuel from a year earlier.
Demand for LPG, other products
OGJ forecasts that this year's demand for liquefied petroleum gases will be nearly unchanged from last year at 2.175 million b/d. This includes ethane, propane, propylene, and other liquids.
Residual fuel oil demand, which has been declining for decades, will fall to 400,000 b/d this year from the 2011 average of 482,000 b/d. Resid is used to power ships and is decreasingly used to fuel electric power plants.
Demand for all other petroleum products will change little from a year ago and average 2.15 million b/d. These products include pentanes plus, petrochemical feedstocks, special naphthas, still gas, waxes, and miscellaneous products, as defined by EIA.
US oil supply
US oil production will jump by 9% from last year with the surge in output from onshore unconventional plays, especially the Bakken and Eagle Ford shale formations. OGJ forecasts that US crude and condensate production this year will average 6.18 million b/d.
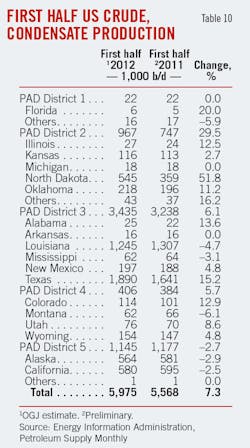
During this year's first half, crude oil production climbed by an estimated 7% to 5.975 million b/d, led by a 52% surge in output in North Dakota to 545,000 b/d. In Texas, oil production is estimated to have increased by 15% in this year's first 6 months.
First-half crude and condensate production is estimated to have declined in Louisiana, California, and Alaska from the same 2011 period. Production in Alaska during this year's first half is estimated at 564,000 b/d, down from 581,000 b/d a year earlier.
NGL production will climb by 10% this year to average 2.4 million b/d, boosted by development of liquids-rich shale plays. Production of renewable fuels and oxygenates will average 970,000 b/d, up almost 2% from last year.
Imports, exports
With climbing US production and limited demand growth, industry oil imports will ebb this year.
Gross imports of crude oil are forecast to dip by 1.3% from last year and average 8.8 million b/d. In 2011, crude oil imports declined by 3% from a year earlier.
Gross product imports will drop to an average 1.8 million b/d from 2.4 million b/d last year.
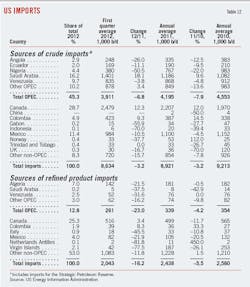
Most US imports of crude and products last year were from Canada, followed by Mexico, Saudi Arabia, and Venezuela.
US exports of crude and products will increase by 4% to average 3 million b/d. Almost all of the oil that the US exports has been refined, as only 47,000 b/d of crude oil was exported in 2011.
The US continues to be a net exporter of petroleum products. The most recent 4-week average of US net product exports was 768,000 b/d, according to EIA.
Oil in storage
Since supply will overtake demand this year, OGJ forecasts a nearly 5% climb in commercial oil stocks from year-end 2011. Inventories declined by 33,000 b/d last year.
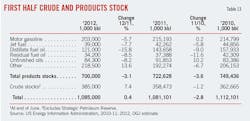
At midyear 2012, crude oil inventories in the US were around 385 million bbl, up from 358 million bbl a year earlier. Product stocks were down from the middle of 2011, totaling about 700 million bbl vs. 723 million bbl at the end of last June.
Inventories of crude oil, excluding the Strategic Petroleum Reserve (SPR), also will end 2012 at 385 million bbl, up from 331 million bbl a year earlier. OGJ forecasts that crude oil in the SPR will be unchanged at 696 million bbl, drawn down from 727 million bbl during the summer of 2011 in the IEA-coordinated release in response to Libya's supply disruption.
Commercial stocks of oil products will close 2012 slightly below end-2011 levels. OGJ sees product inventories totaling 720 million bbl at the end of this year vs. 725 million bbl at yearend 2011.
Refining
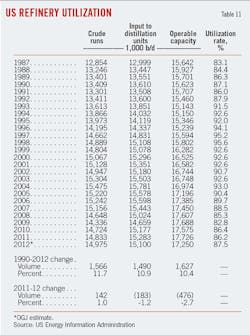
US refinery utilization will climb to 87.5% this year from 86.2%, as operable capacity shrinks by almost 3% from a year ago.
Cash refining margins in the US during the first 5 months of this year were up from a year earlier by 16% on the US Gulf Coast to an average of $6.68/bbl and by 34% on the US West Coast to $14.99/bbl, according to the latest figures from Muse, Stancil & Co.
Refiners in the Rocky Mountain and Western regions have benefitted from a crude-price advantage over US refiners in other regions due to growing production in the Bakken shale and other formations in the Williston basin.
US Midwest refiners recorded an average cash margin during this year's first 5 months of $22.50/bbl, up 13% from a year earlier.
On the US East Coast, where refiners have suffered difficult operating economics for years, the cash operating margin during this year's first 5 months averaged $2.25/bbl, up from 29¢/bbl a year earlier. For all of 2011, the margin averaged just 20¢/bbl, according to Muse, Stancil.
US natural gas market
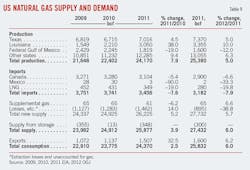
Gas demand growth will slightly outpace production growth in the US this year. Imports will shrink, but exports will increase, resulting in another annual storage build. Inventories of gas in the US will climb by 300 bcf during 2012, mostly as a result of strong output from unconventional resources and warm winter weather.
Marketed production in the US will increase by 5% following a 2011 climb of 8%. Output from the federal Gulf of Mexico will wane, marking 3 years of decline. Output gains in Texas, Louisiana, and other states will result in 25.38 tcf of marketed production this year.
Companies have pulled back on gas drilling when possible in the wake of a prolonged period of depressed prices.
The average wellhead price for gas in the US will be $2.70/Mcf this year, OGJ forecasts.
After recording a 2010 average of $4.48/Mcf, the wellhead price of gas changed little from month-to-month in the first half of 2011 then began a steady monthly decline. The average wellhead price averaged $3.95/Mcf last year.
Front-month futures prices for gas averaged about $2.41/MMbtu in this year's first half.
The low prices, along with increased regulations on coal-fired power plants, are boosting gas demand for electricity generation. Commercial and residential demand for gas still shows weakness following a warmer-than-normal winter.
OGJ forecasts that US gas consumption will total 25.8 tcf this year. Exports will climb to 1.6 tcf from last year's 1.5 tcf. Imports will shrink by 8%, led by a 20% contraction in US imports of liquefied natural gas. Gas imports from Canada and Mexico will also slump from 2011 levels.
More Oil & Gas Journal Current Issue Articles
More Oil & Gas Journal Archives Issue Articles
View Oil and Gas Articles on PennEnergy.com