EIA: Global stock builds to keep oil prices below $60/bbl through 2018
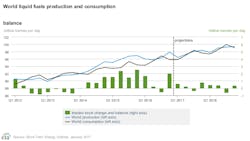
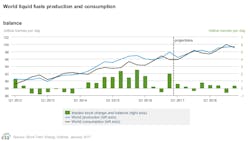
Global petroleum and other liquid fuels inventory builds averaged 900,000 b/d in 2016, marking the third consecutive year of gains. According to the US Energy Information Administration’s Short-Term Energy Outlook, issued this month, the pace of stock builds is expected to slow considerably to an average of 300,000 b/d in 2017 and 100,000 b/d in 2018.
Inventories are forecast to be drawn down by an average of 100,000 b/d in second-half 2018. “Continuing global oil inventory builds contribute to crude oil prices remaining below $60/bbl through the end of 2018,” EIA said.
In this most recent STEO, Brent prices are expected to remain near current levels through 2017, averaging $53/bbl for the year. In 2018, Brent prices are forecast to rise to an average of $56/bbl, ending the year at $59/bbl in December. Upward price pressures are expected to emerge in mid-2018 as the oil market becomes more balanced. EIA’s previous estimates had global markets close to balance in mid-2016.
Oil consumption
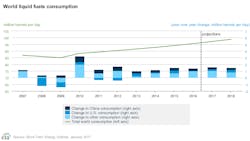
Global consumption of petroleum and other liquid fuels, as driven by nonmembers of the Organization for Economic Cooperation and Development, averaged 95.6 million b/d in 2016, an increase of 1.4 million b/d from 2015.
EIA expects consumption to increase by 1.6 million b/d in 2017 and by 1.5 million b/d in 2018, with 1.2 million b/d of the growth in both years coming from rising non-OECD consumption. Forecast growth in hydrocarbon gas liquids (HGL) consumption is an important driver of overall global liquid fuels consumption growth.
China and India are expected to be the largest contributors to non-OECD petroleum consumption growth.
China’s consumption growth is forecast to average 300,000 b/d in both 2017 and 2018. China’s growth in consumption of petroleum and other liquid fuels is driven by increased use of gasoline, jet fuel, and HGL, which more than offsets decreases in diesel consumption. “Last year’s significant rise in the use of HGL in China will continue through at least 2017 as new propane dehydrogenation (PDH) plants contribute to rising propane use,” EIA said.
In addition to increases in China and India, consumption growth in the Middle East is forecast to average 300,000 b/d in both 2017 and 2018, up from 100,000 million b/d in 2016, led by Saudi Arabia.
OECD petroleum and other liquid fuels consumption will rise by 400,000 b/d in 2017, following an increase of 300,000 b/d in 2016. Increasing consumption in the US, Europe, and South Korea will drive overall OECD consumption growth.
Forecast US total liquid fuels consumption increased by 300,000 b/d in 2017 and by 400,000 b/d in 2018. In 2017, increasing use of gasoline and distillate fuel spur US consumption growth. In 2018, forecast growth is mainly the result of increased use of HGL.
Non-OPEC supply
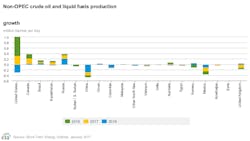
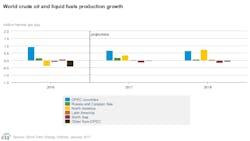
According to EIA estimates, petroleum and other liquid fuels production in non-OPEC oil-producing countries decreased 600,000 b/d in 2016, with more than half of the decrease occurring in North America.
However, EIA expects non-OPEC production to rise by 400,000 b/d in 2017 and by 700,000 b/d in 2018, as total US liquid fuels production increases by 300,000 b/d in 2017 and by 700,000 b/d in 2018, in those respective years, in response to rising oil prices and increases in drilling productivity.
Production in Norway and the UK, both of which posted increases in 2016, is expected to fall in the next 2 years, with total North Sea liquids production declining by more than 100,000 b/d in 2017 and by almost 200,000 b/d in 2018. In Mexico, liquids production is forecast to decline by more than 100,000 b/d in both 2017 and 2018.
Canadian production is expected to increase by about 200,000 b/d in both 2017 and 2018.
In its January STEO, EIA also forecasts that Russia’s production will continue to increase in 2017 and 2018, by 100,000 b/d. Russia’s output broke post-Soviet Union records numerous times in 2016, with liquid fuels production averaging 11.2 million b/d, posting growth of 200,000 b/d during the year.
“Despite the forecast for year-over-year liquid supply growth in 2017, Russia’s production is expected to decline through much of 2017, at least in part due to its agreement with OPEC to restrain output,” EIA said.
Kazakhstan’s output also is expected to rise in 2017 and 2018 as a result of the production restart at giant Kashagan field. Kashagan began commercial production in November 2016, and EIA expects the field will increase output to 300,000 b/d by yearend 2017.
OPEC supply
OPEC crude oil production averaged 32.9 million b/d in 2016, an increase of 800,000 b/d from 2015, led by rising production in Iran, Iraq, and to a lesser extent, Saudi Arabia.
EIA forecasts that OPEC crude oil production rises by 300,000 b/d in 2017, with Iran and Libya accounting for nearly all of the increase. EIA expects that OPEC crude oil output will rise by an additional 500,000 b/d in 2018, driven by an increase in Iraq output.
“The increase in Iraq’s production will likely be delayed from 2017 until 2018 as a result of the November 2016 OPEC production target agreement, limiting Iraq’s output to roughly 4.4 million b/d starting in January…and lasting for 6 months. The forecast assumes that OPEC countries subject to the recent production targets will largely adhere to them,” EIA said.
In addition, OPEC’s largest producer, Saudi Arabia, could increase production heading into the summer months to satisfy domestic demand for crude oil use for electric power generation, which has been as high as 900,000 b/d during peak demand months.
OPEC noncrude liquids production averaged 6.7 million b/d in 2016 and is forecast to increase by 0.3 million b/d in 2017 and by 0.2 million b/d in 2018, led by increases in Iran and Qatar.
