EIA continues to raise oil-price forecasts for 2016-17
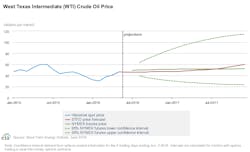
North Sea Brent crude oil prices averaged $47/bbl in May, a $5/bbl increase from April and the fourth consecutive monthly increase since reaching a 12-year low of $31/bbl in January. Growing global oil supply disruptions, rising oil demand, and falling US crude oil production have contributed to the price increase.
In the June Short-Term Energy Outlook, the US Energy Information Administration forecasts Brent crude oil prices to average $43/bbl in 2016 and $52/bbl in 2017, $3/bbl and $1/bbl higher than forecasts in last month’s STEO, respectively.
West Texas Intermediate crude oil prices are forecast to average slightly less than Brent in 2016 and to be the same as Brent in 2017.

EIA estimates that global petroleum and other liquid fuels inventory builds will average 1 million b/d in 2016 and 300,000 b/d in 2017, compared with an average of 1 million b/d in 2016 and 200,000 b/d in 2017 forecast in last month’s STEO.
Global liquids consumption
Global consumption of petroleum and other liquid fuels is now estimated to have risen 1.4 million b/d in 2015, 100,000 b/d higher than previously estimated and reflecting upward revisions to 2015 growth in both China and India.
EIA now expects global oil consumption to rise 1.5 million b/d in both 2016 and 2017. Overall consumption of petroleum and other liquid fuels in countries outside of the Organization for Economic Cooperation and Development increased by an estimated 900,000 b/d in 2015, and it is expected to be 1.3 million b/d in 2016 and 1.4 million b/d in 2017.
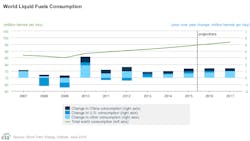
China’s consumption of petroleum and other liquid fuels is forecast to increase 400,000 b/d in both 2016 and 2017, driven by demand for hydrocarbon gas liquids as additional propane dehydrogenation (PDH) plants come online. Consumption growth in India is expected to be between 300,000 b/d and 400,000 b/d in both 2016 and 2017.
OECD petroleum and other liquid fuels consumption rose 500,000 b/d in 2015. OECD consumption is expected to increase 200,000 b/d in 2016 and less than 100,000 b/d in 2017. Consumption growth in the US and South Korea more than offsets decreases in consumption in OECD Europe and Japan in 2016 and 2017.
Non-OPEC petroleum, other liquids
EIA expects production outside the Organization of Petroleum Exporting Countries to decline 600,000 b/d in 2016 and 200,000 b/d in 2017, with most of the production declines occurring in the US.
Forecast total US production of liquid fuels declines 500,000 b/d in 2016 and 100,000 b/d in 2017, as declining crude oil production is partially offset by expected growth in hydrocarbon gas liquids production, Gulf of Mexico crude oil production, and liquid biofuels production.
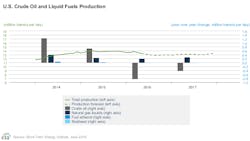
Outside the US, forecast non-OPEC production declined less than 100,000 b/d in 2016 and 100,000 b/d in 2017. Among non-OPEC producers outside of the US, the largest declines are forecast to be in Asia and in the North Sea.
Non-OPEC unplanned supply outages in May were 1.1 million b/d, an increase of 700,000 b/d from April. Most of the increase was in Canada, where wildfires caused disruptions that averaged about 800,000 b/d in May, with a peak of more than 1 million b/d.
OPEC supply
OPEC crude oil production averaged 31.5 million b/d in 2015, an increase of 800,000 b/d from 2014, led by Iraq and Saudi Arabia. According to the June STEO, OPEC crude oil production will rise 800,000 b/d in 2016, with Iran accounting for most of the increase. Forecast OPEC production will rise an additional 700,000 b/d in 2017, as major OPEC producers are expected to continue their strategy of maintaining market share.
OPEC noncrude liquids production averaged 6.6 million b/d in 2015, and it is forecast to rise 300,000 b/d in both 2016 and 2017, led by increases in Iran and Qatar.
OPEC unplanned crude oil supply disruptions averaged nearly 2.6 million b/d in May, 100,000 b/d higher than in April, as increased outages in Nigeria, Iraq, and Libya offset fewer outages in Kuwait.
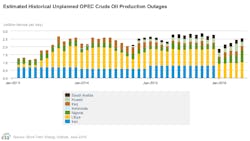
In May, disruptions in Nigeria increased to an average of nearly 800,000 b/d, up from an average of 500,000 b/d in April and an average of 300,000 b/d in 2015. With the increasing disruptions, Nigeria’s crude oil production fell in May to 1.4 million b/d—its lowest monthly average since the late 1980s. Disruptions in Nigeria increased as militants escalated attacks on oil and natural gas infrastructure in the Niger Delta. EIA expects Nigeria’s disruptions to remain relatively high through 2017 compared with recent years.
OPEC surplus crude oil production capacity, which averaged 1.6 million b/d in 2015, is expected to be 1.5 million b/d in 2016 and 1.3 million b/d in 2017.