US oil-rig count posts first increase in 3 months
One week after hitting an all-time low in recorded data, the overall US drilling rig count posted its smallest decline of the year thus far, reflecting the first rise in oil-directed rigs in 13 weeks.
Baker Hughes Inc. reported that 4 units—all gas-directed—stopped operating during the week ended Mar. 18, bringing the new overall working total to 476, down 1,444 units since a pre-drilling-dive peak of 1,920 on Dec. 5, 2014 (OGJ Online, Dec. 5, 2014).
The overall count has now fallen for the 28th time in the past 30 weeks, continuing a slide that has resulted in new lows in recorded data.
Last week, the count officially dropped beneath the previous recorded low of 488 on Apr. 23, 1999, reached during the nadir of the 1998-99 industry downturn (OGJ Online, Mar. 11, 2016).
Meanwhile, Barclays this week revised down projected 2016 exploration and production spending in North America to 40% from 27% in January, reflecting further cuts by more than 90% of companies during that time (OGJ Online, Mar. 18, 2016).
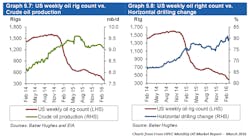
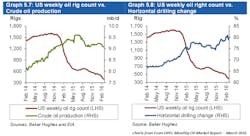
Those firms have compensated for lower available capital by utilizing improved technology and efficiencies, keeping US crude oil production declines far less pronounced relative to rig-count declines (OGJ Online, Feb. 26, 2016).
In an energy brief published this week, the US Energy Information Administration noted that crude production from hydraulic fracturing now represents about half of overall US output.
In 2000, 23,000 fraced wells in the US produced 102,000 b/d of oil, less than 2% of the national total. By 2015, the number of fraced wells rose to an estimated 300,000, and production from those wells rose to more than 4.3 million b/d, about 50% of US overall oil output.
Oil rigs up in US, down in Canada
US oil-directed rigs edged up a unit this week to 387, now down 1,222 units since their peak in BHI data on Oct. 10, 2014.
Between last week and its last increase on Dec. 18, 2015, the oil-directed count had plunged 154 units.
Gas-directed rigs lost 5 units to 89, down more than 100 since last fall and their new lowest level in BHI data that dates back to July 1987.
Onshore rigs also fell 4 units, settling at 446, down 584 year-over-year. Rigs engaged in horizontal drilling posted their smallest decline of the year, shedding 6 units to 369, down 1,003 units since a peak in BHI data on Nov. 21, 2014, and their lowest count since Apr. 27, 2007.
A week after their biggest rise since Oct. 24, 2014, directional drilling rigs edged down a unit to 49.
Both rigs drilling offshore and in inland waters were unchanged this week at 27 and 3, respectively.
Canada’s recent rig-count plunge continued with a 29-unit drop to 69, down 181 units since Jan. 22. Over the past 6 weeks, the count has dived 173 units.
Oil-directed rigs again represented most of the loss, shedding 16 units to 12, down 122 units since Jan. 22 and matching their total entering 2016, which is a low in BHI data that dates back to January 2000. Gas-directed rigs in Canada lost 13 units to 57.
First rise of 2016 for Texas, Eagle Ford
Light activity among the major oil- and gas-producing states this week was headlined by Texas’s first increase of the year. Rising 2 units to 217, the state’s count is still down 741 units since a peak in BHI data on Aug. 29, 2008.
Both of the those units came online in the Eagle Ford, which also posted its first rise of the year. The South Texas shale region’s count is now 45, down 214 units since a peak on May 25, 2012.
Five states reported losses, led by a 2-unit decline in New Mexico to 13, down 88 units from the beginning of 2015 and its lowest level in BHI data that dates back to the 1990s.
Each down a unit each were Oklahoma at 66, North Dakota at 31, Ohio at 10, and Kansas at 8.
Oklahoma is down 143 units compared with when it entered 2015 and at its lowest point in BHI data that dates back to the 1990s. North Dakota is down 172 units since an all-time high during June 1-8, 2012, and at its lowest since Apr. 13, 2007.
The Cana Woodford lost 3 units to 34, and Arkoma Woodford edged down a unit to 3. The Mississippian decreased a unit to 7. Movement in the Williston and Utica reflected exactly that of their respective home states of North Dakota and Ohio.
Contact Matt Zborowski at [email protected].

