BHI: US rig count records 30th loss of past 32 weeks
The overall US drilling rig count declined by double digits during the week ended Apr. 1 for the 11th time in 13 weeks to begin the year.
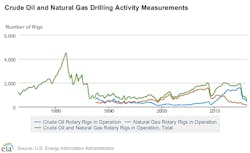
The latest data from Baker Hughes Inc. show the count shed 14 units to settle at a total of 450, down 1,470 units since the drilling dive commenced following the week ended Dec. 5, 2014 (OGJ Online, Dec. 5, 2014).
Posting losses in 30 of the past 32 weeks, the rig count has shown no signs relenting from its downward momentum. Since first hitting a low in recorded data on Mar. 11, the count has dropped an additional 30 units (OGJ Online, Mar. 11, 2016).
The loss of rigs continues to reflect shrinking capital expenditures by beleaguered exploration and production firms, which have worked during the industry contraction to improve operational efficiencies and cut costs to stay afloat.
Drilling, completion costs also falling
A recent study commissioned by the US Energy Information Agency found that average well drilling and completion costs in five key onshore areas in the US during 2015 were 25-30% below 2012 levels—when costs per well were at their highest over the past decade (OGJ Online, Mar. 30, 2016).
Focusing on the Eagle Ford, Bakken, Marcellus, and Midland and Delaware areas of the Permian basin, EIA concluded that costs per well have fallen since 2012 because of reduced overall drilling activity and improved drilling efficiency and tools.
EIA noted that oil areas were affected differently in 2015 by changes in costs and well parameters—such as the need to drill deeper or longer lateral wells—with recent per-well costs ranging 7-22% below 2014 levels. Costs for each oil area differ because of variations in geology, well depth, and water disposal options.
“The drilling cost per foot based on total depth, and the completion cost per foot based on lateral length are both projected to maintain these lower cost trends through 2018,” EIA said. “Sustained lower upstream costs may affect near-term oil and natural gas markets and ultimately the prices of these fuels.”
EIA also reported this month that crude production from hydraulically fractured wells made up about 50% of total US output in 2015, while crude production in the Lower 48 from wells drilled since the start of 2014 made up 48% of total US output in 2015 (OGJ Online, Mar. 24, 2016).
Latest onshore, oil tallies
The US oil-directed rig count dropped 10 units this week to settle at 362, down 1,247 units since its peak in BHI data on Oct. 10, 2014.
Gas-directed rigs lost 4 units to 88, continuing to hit lows not seen in decades.
Onshore units fell 12 units to 420, down 573 year-over-year.
Rigs engaged in horizontal drilling decreased 13 units to 346, down 1,026 units since a peak in BHI data on Nov. 21, 2014, and their lowest count since Apr. 6, 2007. Directional drilling rigs shed 3 units to 49.
Three rigs halted operations offshore Louisiana, partially offset by 1 unit starting up offshore Alaska, bringing the total US count to 26. The tally of rigs drilling in inland waters remained at 4.
Canada’s rig count also continued to hit lows not seen in decades, dropping 6 units to 49, down 201 units since Jan. 22.
While most of the recent declines have been anchored by oil-directed rigs, each unit to go offline this week was gas-directed, which now total 38. Oil-directed rigs remain at 11.
Movement abounds in Texas
A hub of US oil- and gas-related activity, Texas continued to host the bulk of rig count movement this week. The state was down 5 units to 204, down 754 units since a peak in BHI data on Aug. 29, 2008, and its lowest level since the 1990s.
The Granite Wash halved to 4, down 95 units from a peak in BHI data on Sept. 23, 2011. The Permian decreased 2 units to 145, down 423 units since a recent peak on Dec. 5, 2014.
The Eagle Ford gained 1 unit to 42, still down 217 units since a peak on May 25, 2012.
Louisiana fell 4 units to 47, mostly reflecting its offshore rig count’s 3-unit drop. Oklahoma, North Dakota, and California each declined 2 units to 61, 29, and 5, respectively.
Oklahoma is down 148 units compared with when it entered 2015 and at its lowest point in BHI data that dates back to the 1990s. North Dakota is down 174 units since an all-time high during June 1-8, 2012, and at its lowest since July 21, 2006. California’s total also is its lowest in BHI data that dates back to the 1990s.
Each of the Arkoma and Ardmore Woodford areas increased a unit to respective totals of 4 and 2. The Mississippian lost 2 units to 5. The Williston mirrored the movement of its home state, dropping 2 units to 29.
Pennsylvania, Alaska, and Kansas each edged down a unit to 17, 9, and 6, respectively. The Marcellus also edged down a unit, settling at 29.
Utah’s count, meanwhile, doubled to 2. New Mexico added units for the second-straight week, gaining 2 to reach 16.
Contact Matt Zborowski at [email protected].

