EIA: Latest STEO shows US crude output fell 60,000 b/d in November
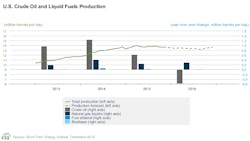
Total US crude oil production declined by about 60,000 b/d in November compared with October, according to estimates by the US Energy Information Administration in its Short-Term Energy Outlook for December.
Production is forecast to decrease through third-quarter 2016 before growth resumes late in 2016. Projected US production averages 9.3 million b/d in 2015 and 8.8 million b/d in 2016.
The latest survey-based reporting of monthly crude oil production estimates indicates that US production through the first 9 months of 2015 averaged 9.4 million b/d, up 100,000 b/d from average production during fourth-quarter 2014 despite a more than 60% decline in the total US oil-directed rig count since October 2014.
However, monthly production started to decrease in the second quarter. Lower 48 onshore output began declining in April, and has fallen from 7.6 million b/d in March to an estimated 7.1 million b/d in November.
Total US crude production began declining in May, and has fallen from 9.6 million b/d in April to an estimated 9.2 million b/d in November. EIA expects US production declines to continue through September 2016, when total output is forecast to average 8.5 million b/d, which would be 1.1 million b/d less than the recent monthly peak reached in April.
Forecast production begins increasing in late 2016, returning to an average of 8.7 million b/d in the fourth quarter. EIA says expected production declines through September 2016 are largely attributable to unattractive returns in some areas of both emerging and mature onshore oil production regions, as well as seasonal factors such as anticipated hurricane-related production disruptions in the Gulf of Mexico.

Projected oil prices below $60/bbl throughout the forecast period are expected to limit onshore drilling activity and well completion totals, despite continued increases in rig and well productivity and falling drilling and completion costs. The forecast remains sensitive to actual wellhead prices and rapidly changing drilling economics that vary across regions and operators.
Projected production in the Gulf of Mexico rises during the forecast period, while production in Alaska falls. Production in these areas is less sensitive to short-term price movements than onshore production in the Lower 48 states and reflects anticipated growth from new projects in the Gulf of Mexico and declines from legacy fields in Alaska, EIA notes.
Twelve projects are scheduled to come online in the gulf in 2015-16, pushing up production from an average of 1.4 million b/d in fourth-quarter 2014 to 1.7 million b/d in fourth-quarter 2016.
EIA notes that the possibility exists that some projects will start production later than expected, shifting some of the anticipated production gains from late 2016 into early 2017.
Global inventory builds
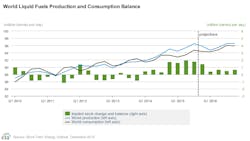
Global petroleum and other liquids production continues to outpace consumption, leading to inventory builds throughout the forecast period. Global oil inventory builds in the third quarter averaged 1.8 million b/d, down from 2 million b/d in the second quarter, which had the largest inventory builds since fourth-quarter 2008. The pace of inventory builds is expected to slow in the fourth quarter to roughly 1.4 million b/d. In 2016, inventory builds are expected to slow further to an average of 600,000 b/d.
EIA estimates that petroleum and other liquids production in 2014 in countries outside of the Organization of Petroleum Exporting Countries increased 2.5 million b/d, which mainly reflects US production growth. EIA expects non-OPEC production to increase 1.2 million b/d in 2015, and then to decline in 2016 by 400,000 b/d, which would be the first annual decline in non-OPEC production since 2008.
Non-OPEC production growth in 2015 is largely attributable to investments committed to projects before the oil price decline that began in mid-2014. The declines in 2016 are mostly because of declines in US onshore and North Sea production. Production growth in Canada is expected to average 100,000 b/d in both 2015 and 2016.
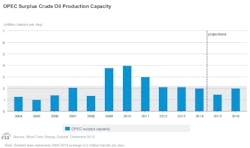
At its Dec. 4 meeting, OPEC members announced they “should continue to closely monitor developments in the coming months (OGJ Online, Dec. 4, 2015).” This indicates OPEC producers, led by Saudi Arabia, are continuing the policy of defending market share in a low oil price environment. EIA estimates OPEC production averaged 31.4 million b/d in November, up 1.3 million b/d from November 2014. Increased output in Saudi Arabia and Iraq is the main driver of higher OPEC production.
OPEC members at the meeting also voted unanimously to reactivate Indonesia’s OPEC membership, despite its remaining a net importer of crude oil. Indonesia had suspended its membership in 2009 after it became a net importer of crude oil.
Starting with the January 2016 STEO, EIA will include Indonesia’s output in the OPEC total for both history and the forecast.
EIA estimates that OPEC crude production averaged 30.1 million b/d in 2014. EIA forecasts OPEC crude production to increase 900,000 b/d in 2015, led by production growth in Iraq. Forecast OPEC production increases 300,000 million b/d in 2016, with Iran expected to increase production once international sanctions targeting its oil sector are suspended.
Although uncertainty remains as to the timing of sanctions relief, EIA assumes the implementation occurs in second-quarter 2016. As a result, EIA forecasts Iranian crude supplies will increase by more than 200,000 b/d on average in 2016, reaching roughly 3.3 million b/d by yearend.
Iraq is producing at record levels, with estimated crude oil production in November averaging 4.5 million b/d, up 700,000 b/d compared with the 3.8 million-b/d average during the first half. The expansion of onshore pumping and storage infrastructure in the south, improvements in crude quality as Basra Light and Basra Heavy were marketed separately, and an increase to the Kurdistan Regional Government’s (KRG) pipeline capacity in the north have all contributed to production growth in Iraq.
EIA expects Iraq’s production growth to slow in 2016 because of budgetary constraints that have prompted the Iraqi government to request international oil companies (IOC) operating in the south to reduce spending plans. The KRG is also experiencing budgetary constraints that contribute to payment delays to IOCs, which could also contribute to slowing production growth next year.
Global consumption
EIA estimates global consumption of petroleum and other liquids increased 1.2 million b/d in 2014, averaging 92.4 million b/d for the year. EIA expects global consumption of petroleum and other liquids to grow 1.4 million b/d in both 2015 and 2016.
Consumption of petroleum and other liquids in countries outside the Organization for Economic Cooperation and Development increased 1.4 million b/d in 2014 and is projected to rise 800,000 b/d in 2015 and 1.1 million b/d in 2016.
China continues to be the main driver of non-OECD oil consumption growth, despite the slowdown in the country’s economic growth that began in second-half 2014. China’s liquid fuels consumption growth is forecast to average 300,000 b/d in 2015 and in 2016, below the 400,000 b/d growth in 2014.
After falling 300,000 b/d in 2014, OECD petroleum and other liquids consumption is expected to rise 600,000 b/d in 2015 and 300,000 b/d in 2016, reaching an average of 46.7 million b/d, the highest annual average level of OECD consumption since 2010. US consumption is expected to increase by an average of 300,000 b/d in 2015 and by 200,000 b/d in 2016.
In 2015, economic conditions improved in several OECD countries in Europe and Asia as they emerged from recessions, contributing to oil demand growth. Also, colder-than-normal weather in OECD Europe in early 2015 contributed to a forecast 300,000 b/d increase in 2015 oil consumption. Consumption in OECD Europe is forecast to increase by 100,000 b/d in 2016.
Inventories weigh down prices
North Sea Brent crude oil prices in November averaged $44/bbl, down $4/bbl from October. Global oil inventories are estimated to have increased by 1.3 million b/d in November, putting downward pressure on Brent prices.
EIA forecasts that Brent crude prices will average $53/bbl in 2015 and $56/bbl in 2016. Forecast West Texas Intermediate crude prices average $4/bbl lower than the Brent price in 2015 and $5/bbl lower in 2016. The current values of futures and options contracts for March 2016 suggest the market expects WTI prices to range $30-63/bbl at the 95% confidence interval.
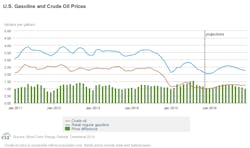
The monthly average price of US regular retail gasoline was $2.16/gal in November, down 13¢/gal from October and 75¢/gal than November 2014. EIA forecasts US regular gasoline retail prices to average $2.04/gal in December and $2.36/gal for 2016.