BP: US surpassing Saudis in oil output among world’s ‘tectonic’ energy shifts in 2014

An eventful 2014 in the world oil and gas markets was headlined by the US overtaking Saudi Arabia as the world’s biggest oil producer and surpassing Russia as the world’s largest producer of both oil and gas, BP PLC said in its 64th Statistical Review of World Energy released June 10.
The US last year recorded the largest oil output growth in the world at 1.6 million b/d, becoming the first country ever to increase production by at least 1 million b/d for 3 consecutive years.
Along with the US, oil production in Canada, up 310,000 b/d, and Brazil, up 230,000 b/d, also reached record levels in 2014, the report notes. While production outside the Organization of Petroleum Exporting Countries increased 2.1 million b/d—the largest increase in BP’s dataset—OPEC output was flat and the group’s share of global production fell to 41%, its lowest since 2003.
Global oil production growth was more than double that of global consumption, rising 2.1 million b/d or 2.3%.
Global oil consumption rose 800,000 b/d, or 0.8%, slightly below its recent historical average and significantly weaker than the increase of 1.4 million b/d seen in 2013 (OGJ Online, June 16, 2014). Oil remained the world’s leading fuel, with 32.6% of global energy consumption, but lost market share for the 15th consecutive year.
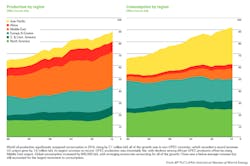
Countries outside the Organization for Economic Cooperation and Development accounted for all of the net growth in global consumption. Chinese consumption growth was below average but still recorded the largest increment to global oil consumption at 390,000 b/d.
OECD consumption declined 1.2%, the eighth decrease in the past 9 years. Light distillates—motor and aviation gasoline, light distillate feedstock—were the fastest-growing refined product category for a second consecutive year.
Global crude runs in 2014 increased 1.1 million b/d, or 1.4%, the highest growth since 2010 and more than double the 10-year average. Refinery runs in the US increased 530,000 b/d, the largest since 1986.
Global refining capacity expanded by an above average 1.3 million b/d, led by additions in China and the Middle East, with Middle Eastern capacity expanding by a record 740,000 b/d.
Global refinery utilization remained at 79.6%, its lowest rate since 1987.
Global trade of crude oil and refined products in 2014 increased by a below average 0.9%, or 490,000 b/d. Import growth was driven by China and other emerging economies, while US net imports declined, the report says. China replaced the US as the world’s largest net oil importer in 2013.
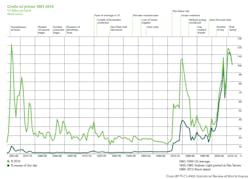
Dated Brent averaged $98.95/bbl in 2014, down $9.71/bbl from the 2013 level and the first annual average below $100/bbl since 2010. The average WTI–Brent differential narrowed to $5.66/bbl from $10.67/bbl in 2013 despite continued robust US production growth, but remained elevated relative to past levels.
Gas consumption weak, CO2 emissions growth down
World natural gas consumption rose just 0.4%, well below the 10-year average of 2.4%. Growth was below average in both the OECD and emerging economies, with consumption in the European Union, down 11.6%, experiencing its largest volumetric and percentage declines on record. The Europe and Eurasia region, down 4.8%, had the five largest volumetric declines in the world in Germany, Italy, Ukraine, France, and the UK. Globally, natural gas accounted for 23.7% of primary energy consumption.
Global natural gas production rose 1.6%, below its 10-year average of 2.5%. Growth was below average in all regions except North America. Up 6.1%, the US recorded the world’s largest increase, accounting for 77% of net global growth. The largest volumetric declines were seen in Russia, down 4.3%, and the Netherlands, down 18.7%.
Global natural gas trade registered a rare contraction in 2014, falling by 3.4%. Pipeline shipments declined 6.2%, the largest decline on record, driven by falls in net pipeline exports from Russia, down 11.8%, and the Netherlands, down 29.9%. Global LNG trade increased 2.4%. International natural gas trade accounted for 29.4% of global consumption, while LNG’s share of global gas trade rose to 33.4%.
Global carbon dioxide emissions from energy use grew by just 0.5%, the weakest since 1998 excluding the immediate aftermath of last decade’s financial crisis. The slower growth relative to its average over the past 10 years or so was largely attributable to the changing pace and pattern of Chinese economic growth.