IEA: Oil price rallied on slowing US LTO production
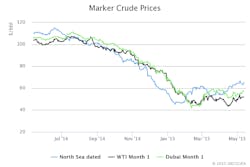
Despite persistently high global supply and continued stock builds, oil prices rallied in April and early May, likely sparked by signs of slowing US light, tight oil (LTO) output, according to the most recent Oil Market Report from the International Energy Agency.
Saudi Arabia’s high-profile military engagement in Yemen’s civil war, as well as higher official selling prices (OSP) for Saudi crude destined for the US and Europe, also may have contributed to the rally.

US benchmarks grade led the rally, with US West Texas Intermediate front-month futures appreciating by an average $6.78/bbl, or nearly 15% in April, vs. $4.20/bbl, or 7.4%, for front-month ICE Brent.
Demand growth
IEA’s OMR forecasts that global oil demand is to rise 1.1 million b/d in 2015, taking average deliveries up to 93.6 million b/d, well above the 700,000 b/d rise in 2014.
“The main factor driving this acceleration is the reversal in [Organization for Economic Cooperation & Development] momentum, switching from a 460,000 b/d decline in 2014 to a gain of 175,000 b/d in 2015, consequential on an improvement in the OECD economic outlook and colder-than-year-earlier winter weather conditions in Europe in the first quarter of 2015,” IEA noted.
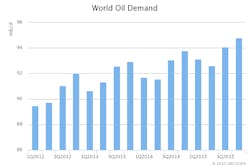
The assessment of global demand in the first quarter has been revised upwards by 130,000 b/d since last month’s OMR, with notable additions applied to China, Germany, Saudi Arabia, and Turkey. The forecast for the year as a whole remains roughly unchanged on last month’s report.
Supply unchanged
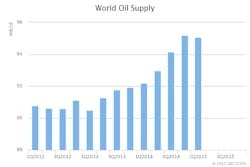
Global oil supply was unchanged in April from a month earlier, at 95.7 million b/d, as a decline in total non-OPEC output offset higher OPEC crude and NGL production.
According to IEA data, non-OPEC production is estimated to have slipped 260,000 b/d in April month-on-month, to 57.9 million b/d, on lower output in North America.
The most recent data indicated that US supply growth is slowly abating, as reductions in capital expenditures and rig-count declines are starting to curb gains in LTO output. The US rig count continued to fall through May 8, with another 145 rigs taken out of service since the end of March (OGJ Online, May 8, 2015).
Canadian and Mexican production in April are pegged lower on scheduled and unscheduled outages.
OPEC crude supply rose 160,000 b/d to 31.21 million b/d in April—the highest since September 2012—as Iraq and Iran boosted output and top exporter Saudi Arabia held flows above 10 million b/d for a second month running.
April marked the 12th consecutive month in which production ran above OPEC’s 30 million b/d supply target. “Early sounding suggest that OPEC will sustain rates at 31 million b/d during May,” IEA said.
OECD stocks, refining
With the relentless increase in US crude stocks, OECD commercial oil inventories defied seasonal trends to add 38.4 million b/d in March, a month where stocks have on average declined by 1.4 million b/d over the past 5 years.
Global supply and demand balances imply a 160-million bbl notional stock build in the first quarter of 2015. Observed data suggest the gains were heavily skewed towards crude.
Global refinery crude runs averaged 78.2 million b/d in this year’s first quarter, up 240,000 b/d on last month’s estimate on upwardly revised throughputs in Asia. Global refinery crude runs are expected to fall seasonally to 77.8 million b/d in the second quarter, but still 500,000 b/d higher than forecast last month.