US energy demand to stay weak in 2012 amid strong oil, gas production
Marilyn Radler
Senior Editor-Economics
Laura Bell
Statistics Editor
US energy demand and economic activity in 2012 will gain some momentum from last year's doldrums, but growth for each will remain anemic.
Total energy demand will increase by 1.2% in the US, according to Oil & Gas Journal's annual Forecast & Review. Early estimates indicate that in 2011, demand climbed by a mere 0.3%.
But uncertainties abound this year—from the state of the European Union and its economies weakened by debt defaults to the effects of the West's reactions to Iran's development of nuclear capabilities—and it's those uncertainties that will drive the 2012 oil market.
Downside economic risks prevail, including China's slowing growth and Europe's troubles spreading to the US. These weaknesses threaten to lower oil demand beyond current expectations.
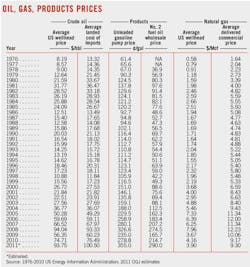
Strong oil prices and improvements in technology will result in an increase in efficiency again in 2012, although prices should ease from 2011. The average US wellhead price for crude oil last year was $93.75/bbl, OGJ estimates. This compares with an average in 2010 of $74.71/bbl.
US oil production will rise, and oil imports will decrease again this year. US refiners, primarily those on the Gulf Coast, will gain access to more domestic crude with the reversal of some key pipelines.
Natural gas demand in the US is set to increase this year with an abundance of supply and low prices, while the use of coal for electric power generation will decline. US demand for nuclear energy and renewable energy sources will climb from a year ago, although the use of hydroelectric power generation will ease from last year's surge.
Worldwide oil demand
Ambiguity about the 2012 global economy looms as the Euro-zone is under pressure amid sovereign debt problems. Borrowing among industrialized nations reached $10 trillion last year and threatens to climb higher this year, according to the Organization for Economic Cooperation and Development.
The International Monetary Fund's (IMF) latest World Economic Outlook, published in September 2011 and entitled "Slowing Growth, Rising Risks," puts 2012 worldwide economic growth at about 4%, the same rate as last year's, but down from the 2010 growth rate of 5.1%.
Among advanced economies, economic growth will average just 1.9% this year, according to projections. IMF expects China's growth to decelerate to 9% this year from 9.5% last year and 10.3% in 2010, while in India growth is forecast at 7.5%, also down from the previous 2 years.
In its December monthly oil market report, the International Energy Agency said a combination of the worsening global economic backdrop and persistently heightened oil prices had resulted in the agency lowering its forecasts for global oil demand in 2011 and 2012, with projections trimmed by 160,000 b/d and 200,000 b/d respectively from the agency's November report.
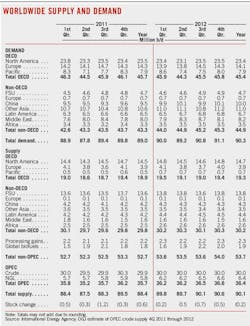
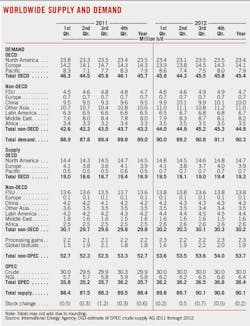
IEA now sees global oil demand averaging 90.3 million b/d this year, up from last year's 89 million b/d. In 2010, demand averaged 88.3 million b/d.
Uncertain prospects for the single European currency continue to provide added downside risk to current economic growth estimates, IEA said.
All of this year's demand growth is set to occur outside OECD member countries, according to IEA, as demand is projected to contract in North America by 0.6% and in OECD Europe by 1.4%. IEA forecasts a small increase in this year's OECD Pacific oil demand to 7.89 million b/d from last year's 7.87 million b/d.
While OGJ forecasts a small increase in 2012 US oil demand following last year's contraction, IEA projects that demand in the 50 states this year will shrink by 0.5%.
Oil demand in China this year is forecast to climb to average 10 million b/d vs. last year's 9.5 million b/d. Demand will rise by 120,000 b/d in India and in Saudi Arabia this year, according to IEA.
In Africa oil demand will increase by 5.1% this year to average 3.5 million b/d, while in Latin America oil demand will grow by 3.2% from a year ago to average 6.7 million b/d, IEA forecasts.
Global oil supply
At its Dec. 14, 2011, meeting, the Organization of Petroleum Exporting Countries agreed to leave its production levels unchanged at 30 million b/d with the expectation of decelerating economic growth and a small increase in non-OPEC supply this year.
The effective output ceiling includes Libyan production, estimated to have averaged 550,000 b/d in November 2011 and off by about 1 million b/d from full production before the country's popular uprising. When full production is again achieved in Libya, other OPEC members would apparently lower output levels to accommodate the increase.
Total non-OPEC oil supply, including crude oil, processing gains, and biofuels, will climb by about 1 million b/d from 2011 to average 53.7 million b/d, according to IEA's latest projections. The 800,000 b/d increase in crude oil supply is forecast to be evenly split between advanced economies of the OECD and the non-OECD developing countries. In addition, the Paris-based agency sees 2012 increases of about 100,000 b/d each in processing gains and biofuels output.
Natural gas liquids production among OPEC members in 2012 will average 6.4 million b/d, up from last year's 5.8 million b/d average, according to IEA.
If OPEC crude output averaged 29.9 million b/d, then total 2011 oil supply was 88.4 million b/d, resulting in a draw in inventories of about 600,000 b/d based on IEA demand estimates.
Assuming IEA's 2012 demand forecast and OPEC crude output of 30 million b/d for the year and the resulting total oil supply of 90.1 million b/d, then inventories would be drawn down by 200,000 b/d this year.
US economy
OGJ forecasts that US gross domestic product will grow by 2% this year, although risks to the downside are high considering persistent high unemployment, continued weakness in the housing marking, growing national debt, and Europe's ongoing financial crisis.
GDP growth last year was 1.6%, OGJ estimates, with the US unemployment rate hovering around 9% for most of the year and then dipping to 8.6% in November, according to figures from the US Bureau of Labor Statistics. The unemployment rate peaked at 10.1% in October of 2009.
After its Dec. 13, 2011, meeting, the Federal Open Market Committee (FOMC) said inflation had moderated since earlier in the year and that data suggested the economy has been expanding moderately. Household spending had picked up, but growth in business investment appeared to have slowed.
FOMC said it would hold the federal funds rate at 0-¼% and anticipated that economic conditions, including low rates of resource utilization and a subdued outlook for inflation over the medium term, are likely to warrant an exceptionally low federal funds rate at least through mid-2013.
Energy in the US
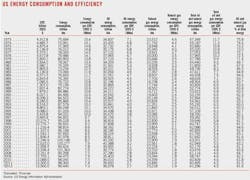
OGJ forecasts that total US energy demand will be 99.44 quadrillion btu (quads) this year, up from an estimated 2010 total of 98.3 quads. While demand for coal will contract, demand for all other major sources of energy will increase modestly from last year.
US energy demand peaked in 2005. Vehicle fuel efficiency, along with the recent economic slump, led to declining demand.
The US will record another gain in energy efficiency this year, as the energy-to-GDP ratio dips to 7.33 quads/$ of GDP from 7.39 quads/$ of GDP a year ago.
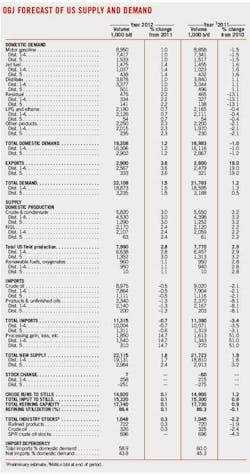
Oil demand in the US will rebound from last year's 1% estimated contraction, posting a 1.2% gain. The growth will be spread among petroleum products due to an increase in consumption of transportation fuels, spurred by the small expected recovery in the overall economy.
A warmer start to the heating season delayed the usual climb in gas demand, as the number of heating-degree days in the 2011 fourth quarter is estimated to have dipped from the final 2010 quarter.
In its latest Short-Term Energy Outlook, the US Energy Information Administration forecasts that this month's number of heating-degree days will also fall short of those a year earlier. The number of cooling-degree days is also expected to be above normal this summer.
The combination of a larger number of gas-fired plants in use for electric power generation and low gas prices will result in a 1.5% increase in gas demand this year, OGJ forecasts, and gas will comprise 25.4% of all energy used in the US.
Together, oil and gas will account for 61.6% of the US energy mix this year. This compares with a 61.5% share in 2011 and 61.8% in 2010. Oil's share, now holding steady at 36.3%, is down from 36.7% in 2010.
Coal demand in the US is declining due to electric power plant retirements in favor of natural gas. OGJ expects coal demand will decline by 2.4% this year to 20 quads.
The use of nuclear energy will rebound to 8.444 quads following last year's nearly 2% drop. Nuclear power generation in the US dipped in the second quarter of 2011 in the wake of the post-earthquake nuclear disaster at Japan's Fukushima power plant. This lull was short-lived, with US demand rebounding in the third quarter to 2010 levels, but the dip resulted in a decline in total 2011 nuclear demand to 8.285 quads.
Consumption of hydroelectric power and other renewable forms of energy will climb by 7.5% this year to 9.7 quads following last year's 11.3% surge. EIA reported that US hydropower generation in 2011 was poised to reach its highest level since 1999, primarily due to high precipitation in the Pacific Northwest.
Normal rain and snow this year will result in a decline in hydropower from last year's level, but other renewable energy sources will continue to climb, including wood, waste, and biofuels. Growth in wind energy, however, will slow this year with the expiration of production tax credits. Although it is growing, solar energy use in the US now totals only about 0.1 quads annually.
US oil supply
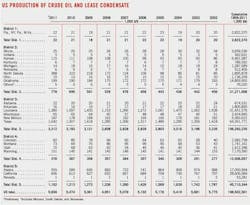
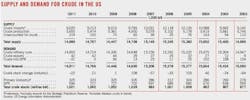
Crude and condensate production in the US will average 5.82 million b/d, climbing 3% from last year.
High oil prices and advanced hydraulic fracturing technology have spurred output increases in unconventional plays such as the Bakken shale as well as the Permian basin and the Eagle Ford shale's light tight oil.
IEA said last month that supply from the Eagle Ford shale has exceeded expectations, leading to a drop in demand for light sweet crude imports into the US Gulf Coast.
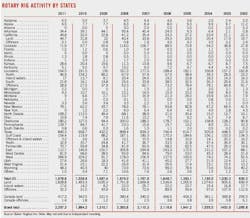
OGJ estimates that 2011 crude and condensate production increased in Texas by 26%, in North Dakota by 25%, and in New Mexico by 5%. Production declines were registered in Louisiana of 14% and in Alaska of 7%, although production from Prudhoe Bay is rebounding a bit.
Natural gas plant liquids production also will be up this year with development of prolific liquids-rich shale gas plays. OGJ forecasts a 2.4% increase in NGL output to 2.17 million b/d.
Imports, exports
Climbing US production will result in import declines, although the declines will be smaller than last year's.
Crude oil imports are forecast to dip by 0.5% from last year and average 8.975 million b/d. In 2010, imports of crude declined by 2.1%.
Product imports will decline by 1.3% to average 2.34 million b/d following last year's 8.1% decline.
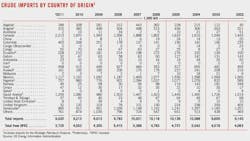
Most US oil imports last year were from Canada, followed by Mexico, Saudi Arabia, and Venezuela.
US exports of crude and products will increase to average 2.9 million b/d from last year's 2.8 million b/d. In 2010, exports averaged 2.353 million b/d, according to EIA figures. Nearly all of the exported volumes are oil products. Only an estimated 42,000 b/d of crude oil was exported in 2011.
Oil inventories
Volumes of crude and products in storage declined by small amounts during 2011 and will change little this year due to lower imports and larger exports, in spite of higher oil production.
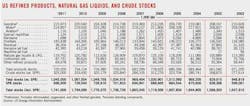
Commercial stocks in the US ended 2011 at 1.045 million bbl, down from 1.067 million bbl a year earlier. Commercial crude stocks were drawn by 2.4% to 325 million bbl.
Crude stored in the Strategic Petroleum Reserve also was drawn during 2011, finishing the year at 695.9 million bbl vs. 727 million—the reserve's capacity—a year earlier. Of the yearend 2011 inventory, sweet crude comprised 262 million bbl.
Last summer 30.64 million bbl were withdrawn and sold from the SPR as part of an IEA coordinated response to offset the oil-supply disruption caused by unrest in the Middle East, especially lost production of Libyan crude (OGJ Online, June 23, 2011).
Refining, pipelines
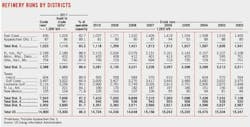
Capacity utilization at US refineries, which operated at an estimated 86.3% of capacity last year, will be little changed this year. Operable capacity will average 17.74 million b/d.
Cash operating margins in 2011 were up in the major refining centers other than the US East Coast, where tough market conditions have persisted for several years.
For the first 11 months of last year, the latest data available as OGJ went to press last week, the US East Coast cash operating margin averaged 37¢/bbl, down from a full-2010 average of $1.82/bbl, according to figures from Muse, Stancil & Co.
Meanwhile, the average 2011 operating margin through November was $21.44/bbl for US Midwest refiners compared with $8.15/bbl in 2010. The improvement in other regions was more muted: up 36% for US Gulf Coast refiners and up 20% for refiners on the US West Coast.
Citing deteriorating refining market conditions, refiner Sunoco Inc. reported last month that it would immediately idle "indefinitely" the main processing units at its 175,000-b/d Marcus Hook, Pa., refinery and continue to seek out a buyer as well as pursue options with third parties for alternate uses of the facility (OGJ Online, Dec. 12, 2011).
Earlier, ConocoPhillips announced its plan to sell its 185,000-b/cd refinery in Trainer, Pa., and associated pipelines and terminals.
Willie Chiang, ConocoPhillips senior vice-president of refining, attributed severe market pressure on US East Coast refining to product imports, weakness in motor fuel demand, and what he called "costly regulatory requirements" (OGJ Online, Sept. 27, 2011).
Also, ConocoPhillips said in November 2011 that it would divest its interest in Seaway Crude Pipeline Co. to Enbridge Holdings (Seaway) LLC, a subsidiary of Enbridge (US) Inc., which will reverse its flow to transport crude to the US Gulf Coast from the oversupplied hub in Cushing, Okla.
Enbridge Inc. and Enterprise Products Partners LP agreed to reverse the direction of oil flows on Seaway with an initial capacity of 150,000 b/d in second-quarter 2012. Following pump station additions and modifications, anticipated to be completed by early 2013, the capacity of the reversed Seaway Pipeline will reach 400,000 b/d (OGJ Online, Nov. 16, 2011).
The reversal of the Seaway pipeline will allow refiners to access supplies from Cushing. In addition, the reversal of Shell's Houma-to‐Houston pipeline by early 2013 will give Gulf Coast refiners easier access to the Eagle Ford crude.
The Shell Pipeline Co. LP project would reverse the existing service to connect the Houston and Port Arthur, Tex., markets with Louisiana markets. The reversal could enable the distribution of approximately 300,000 b/d of crude across the region depending upon the crudes types shipped, the company reported in August 2011.
Oil product demand
All major petroleum products will incur muted increases in demand this year. Transportation fuels will get a minimal boost from economic activity and from slowly declining unemployment, while industrial activity will provide momentum to distillate demand.
Motor gasoline demand will average 8.95 million b/d, up from last year's 8.858 million b/d, but still less than during 2009 and 2010. Regular unleaded pump prices in 2011 posted their highest nominal average ever at an estimated $3.55/gal. This compares with $2.788/gal a year earlier, according to EIA figures.
Averaging 1.475 million b/d and up 1.4% from last year, the use of jet fuel will continue to slowly increase from its recent low of 1.393 million b/d in 2009.
Data through September 2011 from the US Department of Transportation's Bureau of Transportation Statistics show the number of passenger miles flown last year was up from 2010, and flights were full, averaging about 82% of capacity over the past 2 years as airlines have reduced flights.
Like jet fuel demand, demand for distillate fuel oil also will climb for the third consecutive year with an increase in industrial and transportation demand. Including renewable diesel fuel, demand for distillate will average 3.878 million b/d this year, an annual increase of 1% and consisting mostly of ultralow sulfur diesel. The use of distillate for home heating and in electricity generation will continue to decline this year.
Consumption of residual fuel oil, used as fuel for large ships, in electricity generation, and for industrial purposes, will rebound a little to average 475,000 b/d in 2012, up from last year's 465,000 b/d. Resid demand has been in a long-term decline in favor of lighter, cleaner-burning fuels.
Demand for liquefied petroleum gases will climb marginally to 2.18 million b/d after posting a small decline last year, with little change in demand by residential, commercial, or industrial users.
Natural gas market
US gas demand in 2012 will increase due to a slightly stronger economy and low gas prices with an abundance of supply amid increased unconventional resource development. Greater demand will occur in electric power generation with both depressed prices for the fuel and more generation capacity, but demand will be tempered somewhat by efficiency gains.
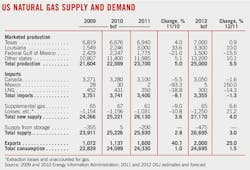
OGJ forecasts that this year's gas demand will total 24.7 tcf, climbing 1.5% this year; last year's increase was 1%.
Marketed gas production in the US will increase by 5.5% to 25 tcf. Last year, gas production jumped by 5%.
Hikes in production in Louisiana, Texas, and other states will more than offset a decline from the offshore federal Gulf of Mexico this year, following a pattern similar to last year's and continuing the proliferation of gas output from shale plays, including the Marcellus in Pennsylvania, the Haynesville in Louisiana, the Barnett in Texas, and others.
EIA estimates show that at 2,222.5 bcf, marketed gas production in Louisiana through September 2011 was nearly as much as for the entire year 2010, when the state's output totaled an estimated 2,246.4 bcf. OGJ estimates that Louisiana's total 2011 gas production climbed by 34% from a year earlier to total 3 tcf.
US gas imports will decline again this year, though by a much smaller margin than during 2011. OGJ forecasts that imports will total 3.355 tcf, down from last year's 3.4 tcf and 3.74 tcf in 2010. Imports of LNG will fall to 300 bcf from last year's 350 bcf, and pipeline gas from Canada and Mexico will decline again.
Meanwhile, the US will post another big increase in gas exports, as this year's total climbs by 25% to 2 tcf. Last year's increase in exports was an estimated 41%, with more gas going to Canada and Mexico by pipeline and to India, Brazil, UK, China, and others as LNG than during 2010, EIA figures show.
The large increase in domestic production combined with strong exports and lower imports will result in an addition to natural gas inventories of 475 bcf for 2012. Last year gas in storage grew by an estimated 200 bcf.
The US wellhead gas price averaged $3.90/Mcf last year, OGJ estimates, down from $4.16/Mcf a year earlier.
More Oil & Gas Journal Current Issue Articles
More Oil & Gas Journal Archives Issue Articles
View Oil and Gas Articles on PennEnergy.com
