Worldwide oil production steady in 2011; reported reserves grow
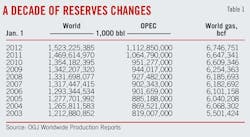
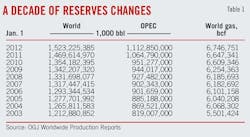
Oil and Gas Journal's annual look at reported worldwide oil reserves shows an increase to 1.52 trillion bbl from 1.47 trillion in last year's survey (OGJ, Dec. 6, 2010, p. 46). The bump in oil reserves is largely due to additions in the Middle East. Natural gas reserves total 6.7 quadrillion cu ft, up 1.5% from those reported a year ago.
OGJ collects estimates of proved reserves from an annual survey of official sources, including government agencies and ministries. Since most countries do not assess their reserves annually, many of the figures in this report are unchanged from a year ago.
Reserves changes
Petroleos Mexicanos (Pemex) reported that as of Jan. 1, Mexico's estimated proved oil reserves totaled 10,161 million bbl, 60% of which is heavy crude, 29% is light crude, and the remaining 11% is extra-light crude. Offshore oil accounts for 69% of the reserves.
Mexico's proved gas reserves total 17,316 bcf, 62% of which is associated gas and 43% is offshore. At 11.966 tcf, the 2010 gas reserve figure that OGJ reported represented dry gas only, while the newest estimate is total gas. Pemex reports that as of Jan. 1, 2010, its total gas reserves were 16.8 tcf.
For some countries, including Australia and Thailand, reported oil reserves figures include large volumes of condensate. Australia's commercial proved and probable condensate reserves total 657.76 million bbl. And Thailand's Department of Mineral Fuels reported reserves of 197 million bbl of crude and 245 million bbl of condensate as of Dec. 31, 2010, vs. a year-earlier combined 435 million bbl of crude and condensate.
In the previous edition of this report, Australia's reserves also were reported using McKelvy classification estimates. This year OGJ obtained the country's traditional industry classification estimates from Geoscience Australia (GA), which reported proved and probable commercial oil reserves in Australia at 767.9 million bbl.
GA also reported that Australia's recoverable crude oil reserves have not yet been declared commercially viable and which may be either geologically proved or are awaiting further appraisal are estimated to be 585 million bbl. Such condensate reserves total 2,075 million bbl.
Proved gas reserves for Mozambique are unchanged from a year ago at 4.5 tcf, although Eni SPA estimates the potential of its offshore Mamba South-1 discovery is 7.5 tcf of gas in place. Eni reported that this discovery can lead to a potential of up to 22.5 tcf of gas in place in the area (OGJ Online, Oct. 27, 2011).
OPEC reserves
Most of the reserves figures reported here for members of the Organization of Petroleum Exporting Countries are referenced from the organization's most recent annual statistical bulletin.
Total oil reserves for OPEC are up almost 5% from a year ago, and gas reserves are up nearly 4% from those figures that OGJ reported last year.
Increases include an 11% climb in Ecuador's reported oil reserves to 7.21 billion bbl and a 24% increase in Iraq's oil reserves to 143.1 billion bbl.
Reported gas reserves climbed by 12% in Iran to 1,168 tcf and declined in Libya by 3% to 52.8 tcf.
OGJ has not changed Venezuela's oil reserves from 211.17 billion bbl, although OPEC's annual review now reports that the country's oil reserves total 296.5 billion bbl. This figure would put the South American producer's reserves above those of Saudi Arabia, where oil reserves are now reported to total 264.52 billion bbl.
OPEC's oil reserves total 1,112.85 trillion bbl, or 73% of the worldwide total. And at 3,330.1 tcf, OPEC's gas reserves account for 49% of the world's gas reserves.
Reserves in the US, Canada
Oil reserves in the US total 20.682 billion bbl, according to estimates released on Nov. 30, 2010, by the US Energy Information Administration. Dry gas reserves were estimated at 272.5 tcf. These totals reflect changes during 2009. No newer estimates were available at presstime last week.
EIA also reported that proved reserves of wet gas in the US, up 11% from a year earlier, total 284 tcf. This is their highest level since 1971, EIA said, despite an approximate one-third decline in the prices used to assess economic viability for 2009 reserves as compared to the prices used in 2008.
Shale gas development in Arkansas, Louisiana, Oklahoma, Pennsylvania, and Texas drove the increase in gas reserves, EIA reported, as Louisiana led the US in additions of proved wet gas reserves with a 77% net increase of 9.2 tcf mostly due to development of the Haynesville shale.
US oil plus lease condensate proved reserves rose 9% to 22.3 billion bbl, regaining 1.8 billion bbl of the 2.3 billion bbl decline posted a year earlier.
In 2009 proved oil reserves in the US increased in each of the five largest crude condensate areas: Texas, the Gulf of Mexico Federal Offshore, California, Alaska, and North Dakota.
Texas had the largest proved reserves increase with 529 million bbl, or 11%, nearly all in the Permian basin. North Dakota reported the second-largest increase at 481 million bbl, up 83%, due to Bakken formation development. A driver for these increases was the higher average level of 2009 oil prices relative to those of December 2008, EIA reported.
Canada's reserves of conventional oil at yearend 2009, the latest figures available from the Canadian Association of Petroleum Producers (CAPP), totaled 687.656 million cu m. In June, Canada's Energy Resources Conservation Board reported that total remaining established crude bitumen in Alberta totaled 169.3 billion bbl.
The latest gas reserves reported for Canada are pegged at 61 tcf, based on yearend 2009 figures from CAPP.
Oil production, demand
Worldwide oil production in 2011 is little changed from a year earlier, OGJ forecasts, declining to average 72.56 million b/d vs. a 2010 average of 72.618 million b/d.
Combined oil output climbed by almost 2% this year in North America, Central America, and South America, led by increases in Canada, Colombia, and the US.
Oil production in Africa declined this year by 11% due to the loss of Libyan output during that country's popular uprising. OGJ forecasts that oil output in Libya in 2011 will average 440,000 b/d, down from last year's 1.55 million b/d.
Production in the North African nation dropped quickly starting in February, averaging just 200,000 b/d in April, then sinking further to record almost no output in August, according to the International Energy Agency. Then production began to ramp up, averaging 75,000 b/d in September and an estimated 350,000 b/d in October and 500,000 b/d in November.
Tullow Oil PLC started production at Jubilee field in Ghana in November 2010, sharply boosting oil production in the country to more than 100,000 b/d. Tullow expects plateau production from Jubilee field to reach 120,000 b/d by yearend.
Oil production in the Middle East will increase by 5% this year, OGJ forecasts, as Saudi Arabia, the UAE, Kuwait, and Iraq post healthy output gains from 2010 in response to a bump in worldwide oil demand. Oil production in Iraq this year is forecast to average 2.48 million b/d, up almost 5% from last year's average.
According to the latest IEA forecasts, 2011 oil demand will average 89.2 million b/d, up from 88.3 million b/d during 2010. Total non-OPEC oil supply is little changed over the period, leaving OPEC to meet demand without further depleting inventories.
While oil output this year will be nearly unchanged from 2010 in Eastern Europe and the former Soviet Union, Western European production will post a 12% decline from last year due to precipitous declines in aging fields. This drop is led by what OGJ estimates to be a 23% collapse in 2011 UK output to 970,000 b/d. In Norway, annual production will sink by about 7% from last year.
In the Asia-Pacific region, collective oil output this year will slide by 2.6%, as declines in Australia, Indonesia, and Malaysia outweigh an increase in India. Average oil production in China for 2011 will be little changed at 4.09 million b/d.
More Oil & Gas Journal Current Issue Articles
More Oil & Gas Journal Archives Issue Articles
View Oil and Gas Articles on PennEnergy.com
About the Author

Marilyn Radler
Senior Editor - Economics
Covers worldwide oil and gas market developments, creates forecasts, and compiles production and reserves statistics for Oil & Gas Journal. She joined OGJ in 1996 as Survey Editor. She holds a BA in Economics from the University of Texas at Austin. A Past President of the Houston chapter of the United States Association for Energy Economics, Marilyn currently serves as a USAEE council member.


