Rafael Sandrea
IPC Petroleum Consultants Inc.
Tulsa
Martin Essenfeld
EGEP Consultores SA
Caracas
New field development requires knowledge of reservoir heterogeneity before drilling additional exploratory or appraisal wells. An expensive, highly integrated mix of signal processing and machine learning typically determines petrophysical properties of the subsurface, mainly from seismic and well-log data. By contrast, this study delivers a simple and reliable correlation between Dykstra-Parsons permeability variance (DPV) and seismic velocity (Vp) to provide heterogeneity estimates.
The model directly relates rock attributes (heterogeneity, porosity, and permeability) to seismic velocity to populate a simulator grid. This correlation, combined with correlations between DVP and Vp with porosity, also estimates porosity and permeability for areas outside core and log data.

Seismic provides reservoir data without gaps over long distances, and the DPV-Vp correlation addresses a newly discovered oil or gas field with petrophysics available only from a discovery well which covers a narrow areal region relative to the extent of the prospect. The model converts seismic data into meaningful petrophysical information initially around the first appraisal well, followed by upgrades over the entire grid as new well information becomes progressively available.
The model was tested against well log and seismic data from Guafita field in Venezuela. Correlations between DPV, seismic p-wave velocity (Vp), and porosity (ɸ) closely match between experimental and modeled values throughout the porosity range.
Reservoir heterogeneity
Reservoir heterogeneity is the most difficult of a reservoir’s five main characteristics: net thickness, permeability, porosity, heterogeneity, and pore-pressure gradient. It is crucial in determining the optimum location of costly appraisal wells in a newly discovered oil or gas field and during development, when early water or gas injection become operational priorities.
Heterogeneity and fluid mobility ratio determines oil recovery for any fluid injection project. Most critically, heterogeneity is the only reservoir characteristic that cannot be measured by well logs, cores, or other direct method. It was first defined by Dykstra-Parsons in 1950, and their model continues as a standard heterogeneity indicator for the industry.1 2 Using core-established permeability values at 1-ft intervals to determine their dispersion, Dykstra-Parsons developed the variance relationship in Equation 1.
Both k50 and k84.1 are obtained from a log-probability chart where available laboratory measurements on core-samples are ordered and graphed. DPV ranges from zero for a uniform or homogeneous reservoir to a maximum of one for extremely heterogenous reservoirs. Field variations often range from 0.30-0.60. In a recent paper, the authors developed a well-log derived DPV methodology (DPVlog) that reliably estimates DPV from core data (OGJ, Jul. 3, 2023, pp. 32-36).
Guafita field heterogeneity
Seismic petrophysics determined heterogeneity in the Guafita oil field which contains more than 200 wells, adequate core and log data, historic well production data, and 3D seismic data over the area (70 sq km) of the reservoir. The field was discovered in 1984 and is separated by faults from its Cano-Limon Colombian counterpart which also contains several minor faults (Fig. 1).3 4 The Mio-Oligocene Guafita formation comprises the main production unit, with formation depths from 7,500 ft. It contains a packet of four clean, consolidated sands with an average 2-d permeability, 25% porosity, and 760-ft gross thickness. Oil gravity is 29° API. Thirteen wells were analyzed in the field to determine reservoir structure.

Fig. 2 shows an integrated petrophysical section for a single well, GF-209, based on seismic and log data. The illustrated log is a composite side-by-side comparison of seismic and log traces. Check shots, which are borehole seismic data measuring seismic travel time from the surface to a known depth, support travel time to depth correlation (DT) using the nearest seismic lines. IP is acoustic impedance of p-wave, and RC is reservoir characteristic.
Near-well seismic data produced a synthetic seismogram at the physical well location, and the real gamma ray (GR) log supported formation-top picks. Thus, petrophysical log-derived properties are tied to the seismic information at the specific well location.
Seismic-wave velocity provides the accuracy required to predict rock properties (ɸ and k) and fluid content. Integration requires a domain conversion because seismic data are typically measured in sonic travel time and log data are measured in depth. Domain conversion between time and depth is performed through a velocity function. Each parameter (porosity, shalyness, permeability, and interval velocity) must have similar values after calibration when obtained or inferred from different sources. This criterion will ensure that results are intrinsically coherent since they refer to a single physical system.

Similar sections were analyzed for each of the 13 sample wells used in this study. These wells were chosen specifically because their data contain the requisites for velocity determination: sonic logs, check shot surveys, and proximity to seismic lines.
The table summarizes pertinent reservoir data, nominal and calculated, for each study well. Log analysis for each major producing hydrocarbon sand layer in the field estimated reservoir sand depths, average porosity, permeability, interval, and heterogeneity. The main objective of this study was to obtain the correlation between seismic-derived interval velocity and DPV through proprietary analysis.
Seismic-processing workflow
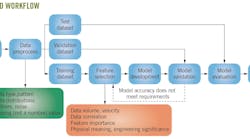
The workflow generates a Vp profile for each study well, establishes the principal producing layers that have distinct seismic velocity signatures, and calculates DPV for each layer. DPV was first calculated using log-derived permeabilities based on the Wyllie-Rose algorithm (Equation 2).
Swirr is a necessary condition to validate the estimated absolute rock permeability. The log-derived permeability methodology provides reliable DPV for formation thicknesses not covered by sparse core data. DPV is a complex composite parameter that reflects permeability, porosity, and irreducible water saturation. Porosity and pore-size distribution, however, are the only variable reservoir parameters which are considered together because equal volumetrically weighted average porosities could correspond to different pore-size distributions. Swirr, by contrast, can vary based on pore-size distribution even under conditions of similar porosities. Under the proposed approach, the detailed rock properties estimated from logs, properly correlated with seismic information at the discovery well, estimate DPV over areas beyond the discovery well using the available seismic interpretation over the entire area.


A recent study correlated experimental Vp and ɸ for shaly sandstones and carbonates (Figs. 3-4, respectively).5 These graphs show strong seismic-petrophysical correlation between Vp and ɸ, though for sandstones the relationships are affected by shale content.
Fig. 5 shows a similar correlation between DPV heterogeneity and porosity for 22 producing sand layers of different shalyness from seven oil fields in three different countries. The underlying DPVlog-versus-porosity relationship follows from the Wyllie-Rose algorithm.

Combining Figs. 3-5, a comparable relationship appears between DPVlog and interval Vp (obtained from seismic data). Porosity is the common thread, and the porosity-seismic velocity trend calibrates DPV in the area using discovery well logs and cores. Seismic Vp data distant from the discovery well, therefore, supports porosity estimates for sand packages. For carbonates, the different porosity types preclude this approach unless refined.
Similar porosity will yield different permeability estimates depending on pore-size distribution (i.e. as reflected by Swirr). Using Swirr-ɸ relationships from earlier work (OGJ Jul. 3, 2023, pp. 32-36), and formation-sand quality as confirmed in the discovery well, the characteristic Swirr selected for the porosity will yield areally and volumetrically distributed permeabilities. DPV heterogeneity is then derived from these permeabilities through Equation 1.
Expanding heterogeneity
Fig. 6 shows the corresponding correlation of Vp and ɸ for 44 sand intervals in Guafita. It includes a few random data points from the trendline of Schon’s analogous plot (Fig. 3) that were superimposed and highlighted on this Guafita plot to show the correlation between experimental and field data. Likewise, Fig. 7 shows the correlation of DPV and ɸ for the same 44 sand intervals in Guafita and includes random data points from the trendline of its analogous plot (Fig. 5) that represent a mix of data from seven oil fields. Experimental- and field-data correlations closely match throughout the porosity range.


Fig. 8 shows the correlation between DPV and Vp for the 44 sand intervals in 13 control wells analyzed for Guafita field. The results confirm heterogeneity estimations throughout the grid by combining petrophysics and seismic data. The relationship also estimates porosity and permeability. After obtaining Vp at any desired location in the prospect, Fig. 8 provides the corresponding DPV value and Fig. 7, or Schon’s correlation (Fig. 3) for tighter formations, provides the corresponding porosity value. This porosity can then be substituted into Equation 2 to estimate permeability.

References
- Dykstra, H. and Parsons, R. L., “The Prediction of Oil recovery by Waterflood, Secondary Recovery of Oil in the United States,” API, Dallas, 1950, pp. 160-174.
- Johnson, C. E., “Prediction of Oil Recovery by Water Flood – A Simplified Graphical Treatment of the Dykstra-Parsons Method,” Trans., AIME, Vol. 207, 1956, pp. 345-346.
- Carlos, B.R., “Seismic Structural Interpretation and Attributes Used to Establish Characteristics of the G-10, G-8 and G-7 Sands of the Guafita Formation, Barinas Apure Basin, Thesis, Central University of Venezuela, Caracas, June 2006.
- Maita G., Adolfo J., “Seismic Attributes Used to Interpret the Structure and Stratigraphy of the Gf-205X Guafita Trap, Apure State,” Thesis, Central University of Venezuela, Caracas, June, 2010.
- Schon, J.H., Developments in Petroleum Science, Vol. 65, “Physical Properties of RocksL Fundamentals and Principles of Petrophysics,” 2nd Edition, Elsevier, Amsterdam, 2015.
Authors
Rafael Sandrea is president of IPC Petroleum Consultants Inc. in Tulsa. He holds a PhD (1967) in petroleum engineering from Penn State and is a life member of SPE, member of the UN ad hoc Group of Experts on Fossil Resources, Geneva, and a distinguished fellow at EPRINC.
Martin Essenfeld is president of EGEP Consultores SA. He holds a PhD (1970) in petroleum and natural gas engineering from Penn State, is a life member of SPE, and has more than 30 years teaching experience while working with EGEP.
Attribution
Special thanks to Yeni Fereira for all data handling and additional data interpretation, and to Miguel Castillejo, Universidad Central de Venezuela, for helping with data research.